Dynamo Logging

View as Markdown

Overview

Dynamo provides structured logging in both text as well as JSONL. When JSONL is enabled logs additionally contain span creation and exit events as well as support for trace_id and span_id fields for distributed tracing.

Environment Variables

VariableDescriptionDefaultExample
DYN_LOGGING_JSONLEnable JSONL logging formatfalsetrue
DYN_LOGLog levels per target <default_level>,<module_path>=<level>,<module_path>=<level>infoDYN_LOG=info,dynamo_runtime::system_status_server:trace
DYN_LOG_USE_LOCAL_TZUse local timezone for timestamps (default is UTC)falsetrue
DYN_LOGGING_CONFIG_PATHPath to custom TOML logging configurationnone/path/to/config.toml
OTEL_SERVICE_NAMEService name for trace and span informationdynamodynamo-frontend
OTEL_EXPORT_ENABLEDEnable OTLP trace exportingfalsetrue
OTEL_EXPORTER_OTLP_TRACES_ENDPOINTOTLP exporter endpointhttp://localhost:4317http://tempo:4317

Getting Started Quickly

Start Observability Stack

For collecting and visualizing logs with Grafana Loki (Kubernetes), or viewing trace context in logs alongside Grafana Tempo, start the observability stack. See Observability Getting Started for instructions.

Enable Structured Logging

Enable structured JSONL logging:

$export DYN_LOGGING_JSONL=true
$export DYN_LOG=debug
$
$# Start your Dynamo components (default port 8000, override with --http-port or DYN_HTTP_PORT env var)
$python -m dynamo.frontend &
$python -m dynamo.vllm --model Qwen/Qwen3-0.6B --enforce-eager &

Logs will be written to stderr in JSONL format with trace context.

Available Logging Levels

Logging Levels (Least to Most Verbose)Description
ERRORCritical errors (e.g., unrecoverable failures, resource exhaustion)
WARNUnexpected or degraded situations (e.g., retries, recoverable errors)
INFOOperational information (e.g., startup/shutdown, major events)
DEBUGGeneral debugging information (e.g., variable values, flow control)
TRACEVery low-level, detailed information (e.g., internal algorithm steps)

Example Readable Format

Environment Setting:

export DYN_LOG="info,dynamo_runtime::system_status_server:trace"
export DYN_LOGGING_JSONL="false"

Resulting Log format:

2025-09-02T15:50:01.770028Z INFO main.init: VllmWorker for Qwen/Qwen3-0.6B has been initialized
2025-09-02T15:50:01.770195Z INFO main.init: Reading Events from tcp://127.0.0.1:21555
2025-09-02T15:50:01.770265Z INFO main.init: Getting engine runtime configuration metadata from vLLM engine...
2025-09-02T15:50:01.770316Z INFO main.get_engine_cache_info: Cache config values: {'num_gpu_blocks': 24064}
2025-09-02T15:50:01.770358Z INFO main.get_engine_cache_info: Scheduler config values: {'max_num_seqs': 256, 'max_num_batched_tokens': 2048}

Example JSONL Format

Environment Setting:

export DYN_LOG="info,dynamo_runtime::system_status_server:trace"
export DYN_LOGGING_JSONL="true"

Resulting Log format:

{"time":"2025-09-02T15:53:31.943377Z","level":"INFO","target":"log","message":"VllmWorker for Qwen/Qwen3-0.6B has been initialized","log.file":"/opt/dynamo/venv/lib/python3.12/site-packages/dynamo/vllm/main.py","log.line":191,"log.target":"main.init"}
{"time":"2025-09-02T15:53:31.943550Z","level":"INFO","target":"log","message":"Reading Events from tcp://127.0.0.1:26771","log.file":"/opt/dynamo/venv/lib/python3.12/site-packages/dynamo/vllm/main.py","log.line":212,"log.target":"main.init"}
{"time":"2025-09-02T15:53:31.943636Z","level":"INFO","target":"log","message":"Getting engine runtime configuration metadata from vLLM engine...","log.file":"/opt/dynamo/venv/lib/python3.12/site-packages/dynamo/vllm/main.py","log.line":220,"log.target":"main.init"}
{"time":"2025-09-02T15:53:31.943701Z","level":"INFO","target":"log","message":"Cache config values: {'num_gpu_blocks': 24064}","log.file":"/opt/dynamo/venv/lib/python3.12/site-packages/dynamo/vllm/main.py","log.line":267,"log.target":"main.get_engine_cache_info"}
{"time":"2025-09-02T15:53:31.943747Z","level":"INFO","target":"log","message":"Scheduler config values: {'max_num_seqs': 256, 'max_num_batched_tokens': 2048}","log.file":"/opt/dynamo/venv/lib/python3.12/site-packages/dynamo/vllm/main.py","log.line":268,"log.target":"main.get_engine_cache_info"}

Logging of Trace and Span IDs

When DYN_LOGGING_JSONL is enabled, all logs include trace_id and span_id fields, and spans are automatically created for requests. This is useful for short debugging sessions where you want to examine trace context in logs without setting up a full tracing backend and for correlating log messages with traces.

The trace and span information uses the OpenTelemetry format and libraries, which means the IDs are compatible with OpenTelemetry-based tracing backends like Tempo or Jaeger if you later choose to enable trace export.

This section has overlap with Distributed Tracing with Tempo. For trace visualization in Grafana Tempo and persistent trace analysis, see Distributed Tracing with Tempo.

Configuration for Logging

To see trace information in logs:

$export DYN_LOGGING_JSONL=true
$export DYN_LOG=debug # Set to debug to see detailed trace logs
$
$# Start your Dynamo components (e.g., frontend and worker) (default port 8000, override with --http-port or DYN_HTTP_PORT env var)
$python -m dynamo.frontend &
$python -m dynamo.vllm --model Qwen/Qwen3-0.6B --enforce-eager &

This enables JSONL logging with trace_id and span_id fields. Traces appear in logs but are not exported to any backend.

Example Request

Send a request to generate logs with trace context:

$curl -H 'Content-Type: application/json' \
>-H 'x-request-id: test-trace-001' \
>-d '{
> "model": "Qwen/Qwen3-0.6B",
> "max_completion_tokens": 100,
> "messages": [
> {"role": "user", "content": "What is the capital of France?"}
> ]
>}' \
>http://localhost:8000/v1/chat/completions

Check the logs (stderr) for JSONL output containing trace_id, span_id, and x_request_id fields.

Trace and Span Information in Logs

This section shows how trace and span information appears in JSONL logs. These logs can be used to understand request flows even without a trace visualization backend.

Example Disaggregated Trace in Grafana

When viewing the corresponding trace in Grafana, you should be able to see something like the following:
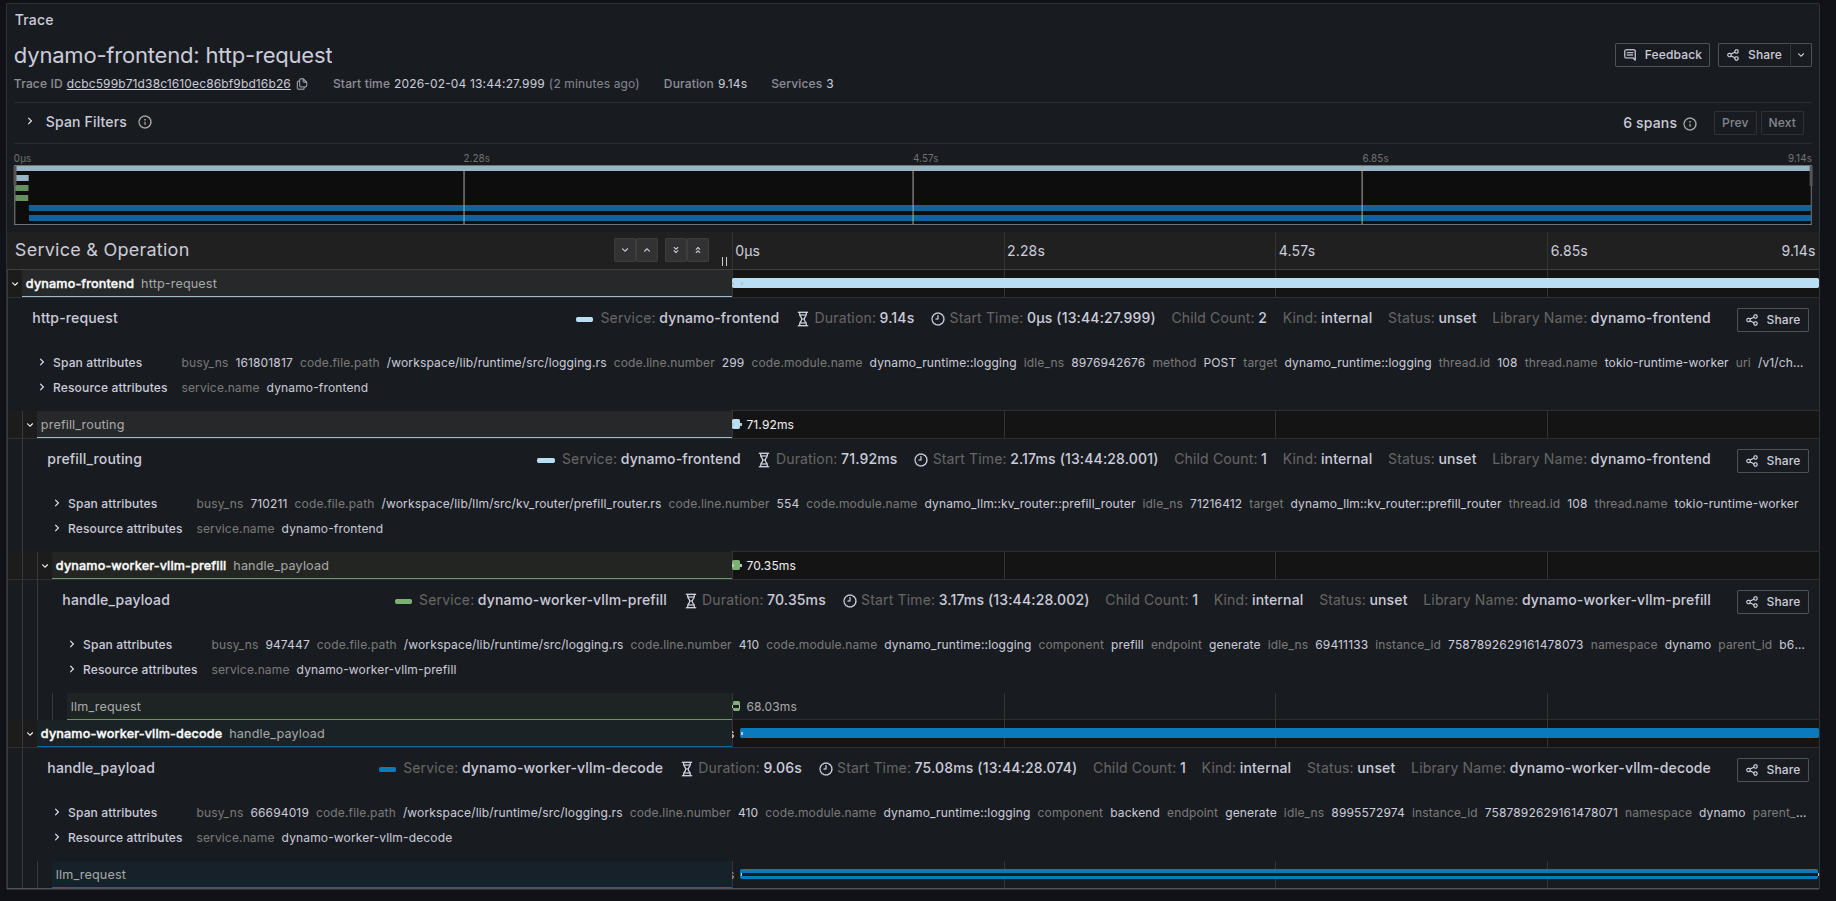
Disaggregated Trace Example

Trace Overview

AttributeValue
Trace IDb672ccf48683b392891c5cb4163d4b51
Start Time2025-10-31 13:52:10.706
Duration4.04s
RequestPOST /v1/chat/completions

Root Span (Frontend): http-request

AttributeValue
Servicefrontend
Span ID5c20cc08e6afb2b7
Duration4.04s
Start Time13:52:10.706
Statusunset
MethodPOST
URI/v1/chat/completions
HTTP VersionHTTP/1.1
Parent ID(none)
Child Count2
Busy Time18,101,350 ns (18.10ms)
Idle Time4,022,100,356 ns (4.02s)

Child Span (Prefill): handle_payload

AttributeValue
Serviceprefill
Duration39.65ms
Start Time13:52:10.707
Statusunset
Componentprefill
Endpointgenerate
Namespacevllm-disagg
Instance ID3866790875219207267
Trace IDb672ccf48683b392891c5cb4163d4b51
Parent ID5c20cc08e6afb2b7
Busy Time613,633 ns (0.61ms)
Idle Time36,340,242 ns (36.34ms)

Child Span (Decode): handle_payload

AttributeValue
Servicedecode
Duration4s
Start Time13:52:10.745
Statusunset
Componentbackend
Endpointgenerate
Namespacevllm-disagg
Instance ID3866790875219207263
Trace IDb672ccf48683b392891c5cb4163d4b51
Parent ID5c20cc08e6afb2b7
Busy Time3,795,258 ns (3.79ms)
Idle Time3,996,532,471 ns (3.99s)

Frontend Logs with Trace Context

The following shows the JSONL logs from the frontend service for the same request. Note the trace_id field (b672ccf48683b392891c5cb4163d4b51) that correlates all logs for this request, and the span_id field that identifies individual operations:

{"time":"2025-10-31T20:52:07.707164Z","level":"INFO","file":"/opt/dynamo/lib/runtime/src/logging.rs","line":806,"target":"dynamo_runtime::logging","message":"OTLP export enabled","endpoint":"http://tempo.tm.svc.cluster.local:4317","service":"frontend"}
{"time":"2025-10-31T20:52:10.707164Z","level":"DEBUG","file":"/opt/dynamo/lib/runtime/src/pipeline/network/tcp/server.rs","line":230,"target":"dynamo_runtime::pipeline::network::tcp::server","message":"Registering new TcpStream on 10.0.4.65:41959","method":"POST","span_id":"5c20cc08e6afb2b7","span_name":"http-request","trace_id":"b672ccf48683b392891c5cb4163d4b51","uri":"/v1/chat/completions","version":"HTTP/1.1"}
{"time":"2025-10-31T20:52:10.745264Z","level":"DEBUG","file":"/opt/dynamo/lib/llm/src/kv_router/prefill_router.rs","line":232,"target":"dynamo_llm::kv_router::prefill_router","message":"Prefill succeeded, using disaggregated params for decode","method":"POST","span_id":"5c20cc08e6afb2b7","span_name":"http-request","trace_id":"b672ccf48683b392891c5cb4163d4b51","uri":"/v1/chat/completions","version":"HTTP/1.1"}
{"time":"2025-10-31T20:52:10.745545Z","level":"DEBUG","file":"/opt/dynamo/lib/runtime/src/pipeline/network/tcp/server.rs","line":230,"target":"dynamo_runtime::pipeline::network::tcp::server","message":"Registering new TcpStream on 10.0.4.65:41959","method":"POST","span_id":"5c20cc08e6afb2b7","span_name":"http-request","trace_id":"b672ccf48683b392891c5cb4163d4b51","uri":"/v1/chat/completions","version":"HTTP/1.1"}

Custom Request IDs in Logs

You can provide a custom request ID using the x-request-id header. This ID will be attached to all spans and logs for that request, making it easier to correlate traces with application-level request tracking.

Example Request with Custom Request ID

1curl -X POST http://localhost:8000/v1/chat/completions \
2 -H 'Content-Type: application/json' \
3 -H 'x-request-id: 8372eac7-5f43-4d76-beca-0a94cfb311d0' \
4 -d '{
5 "model": "Qwen/Qwen3-0.6B",
6 "messages": [
7 {
8 "role": "user",
9 "content": "Explain why Roger Federer is considered one of the greatest tennis players of all time"
10 }
11 ],
12 "stream": false,
13 "max_tokens": 1000
14 }'

All spans and logs for this request will include the x_request_id attribute with value 8372eac7-5f43-4d76-beca-0a94cfb311d0.

Frontend Logs with Custom Request ID

Notice how the x_request_id field appears in all log entries, alongside the trace_id (80196f3e3a6fdf06d23bb9ada3788518) and span_id:

{"time":"2025-10-31T21:06:45.397194Z","level":"DEBUG","file":"/opt/dynamo/lib/runtime/src/pipeline/network/tcp/server.rs","line":230,"target":"dynamo_runtime::pipeline::network::tcp::server","message":"Registering new TcpStream on 10.0.4.65:41959","method":"POST","span_id":"f7e487a9d2a6bf38","span_name":"http-request","trace_id":"80196f3e3a6fdf06d23bb9ada3788518","uri":"/v1/chat/completions","version":"HTTP/1.1","x_request_id":"8372eac7-5f43-4d76-beca-0a94cfb311d0"}
{"time":"2025-10-31T21:06:45.418584Z","level":"DEBUG","file":"/opt/dynamo/lib/llm/src/kv_router/prefill_router.rs","line":232,"target":"dynamo_llm::kv_router::prefill_router","message":"Prefill succeeded, using disaggregated params for decode","method":"POST","span_id":"f7e487a9d2a6bf38","span_name":"http-request","trace_id":"80196f3e3a6fdf06d23bb9ada3788518","uri":"/v1/chat/completions","version":"HTTP/1.1","x_request_id":"8372eac7-5f43-4d76-beca-0a94cfb311d0"}
{"time":"2025-10-31T21:06:45.418854Z","level":"DEBUG","file":"/opt/dynamo/lib/runtime/src/pipeline/network/tcp/server.rs","line":230,"target":"dynamo_runtime::pipeline::network::tcp::server","message":"Registering new TcpStream on 10.0.4.65:41959","method":"POST","span_id":"f7e487a9d2a6bf38","span_name":"http-request","trace_id":"80196f3e3a6fdf06d23bb9ada3788518","uri":"/v1/chat/completions","version":"HTTP/1.1","x_request_id":"8372eac7-5f43-4d76-beca-0a94cfb311d0"}