

Profiler Guide
Overview
The Dynamo Profiler analyzes model inference performance and generates optimized deployment configurations (DynamoGraphDeployments). Given a model, hardware, and SLA targets, it determines the best parallelization strategy, selects optimal prefill and decode engine configurations, and produces a ready-to-deploy DGD YAML.
The profiler accepts a DynamoGraphDeploymentRequestSpec (DGDR) as input and uses AI Configurator (AIC) for performance simulation, candidate enumeration, and configuration picking. When the planner is enabled, the profiler also emits native AIC perf-model identity for the Rust engine perf shim and can generate optional engine interpolation curves used to bootstrap runtime autoscaling.
Workflow
- What model you want to deploy (
model) - How it should perform (SLA targets:
sla.ttft,sla.itl) - Where it should run (optional GPU preferences via
hardware) - Which backend to use (
backend: auto, vllm, sglang, or trtllm) - Which image to use (
image)
The profiler follows this pipeline:
Stage-by-stage walkthrough
-
Validation: The DGDR spec is validated — required fields checked (
image,hardware.gpuSku,hardware.numGpusPerNode), SLA targets verified, and gate checks applied (see Gate Checks). -
Search Strategy: The profiler branches based on
searchStrategy:- Rapid: Uses AIC simulation to estimate performance across parallelization configs. No GPUs needed, completes in ~30 seconds.
- Thorough: Enumerates candidate parallelization configs via AIC, deploys each on real GPUs, benchmarks with AIPerf, then picks the best. Takes 2-4 hours, disagg mode only.
-
Picking: The profiler selects the best configuration using one of three modes, determined automatically from the DGDR spec (see Picking Modes).
-
DGD Generation: The picked configuration is rendered into a complete DGD YAML via AIC’s generator pipeline, including correct parallelization, replica counts, container image, and PVC mounts.
-
Interpolation (planner bootstrap/mocker): When mocker or planner bootstrap data is requested, the profiler generates detailed performance interpolation curves — TTFT vs ISL for prefill, ITL vs KV-cache utilization for decode. In thorough sweeping, these are stored as NPZ files and later packaged into a ConfigMap during final assembly. In rapid sweeping, consumers use AIC performance-model flags, planner
aic_perf_model, or in-process interpolation instead, so no profile-data ConfigMap is generated. -
Final Assembly (3 composable layers):
- Mocker base: If mocker is enabled, the base DGD is swapped for the mocker DGD template (
generate_mocker_config). Otherwise the AIC-picked DGD is kept. - Planner service: If the planner is enabled, the Planner pod and its planner-config ConfigMap are injected into the DGD (
add_planner_to_config). - Profile data: In thorough sweeping, if mocker is enabled or planner throughput-based scaling is enabled, the interpolation data ConfigMap is created and mounted into all consumers — the Planner service and/or mocker workers (
add_profile_data_to_config). Rapid sweeping does not create this ConfigMap.
The result is written to
final_config.yaml. - Mocker base: If mocker is enabled, the base DGD is swapped for the mocker DGD template (
Search Strategies
Rapid
Uses AIC’s performance simulation to estimate optimal configurations without deploying real engines. Completes in ~30 seconds.
- Supports all backends: vLLM, SGLang, TensorRT-LLM
- If the model/hardware/backend combination is not supported by AIC, falls back to a naive config (memory-fit TP calculation)
- No GPU resources consumed during profiling
Thorough
Enumerates candidate parallelization configs, deploys each as a real K8s workload, and benchmarks with AIPerf.
- Only disaggregated mode is supported
- Does not support
autobackend — specifyvllm,sglang, ortrtllm - Takes 2-4 hours depending on the number of candidates
- Provides highest accuracy since measurements come from real hardware
Picking Modes
The profiler automatically selects a picking mode based on the DGDR spec:
Autoscale
Triggered when the planner is enabled (scaling enabled in features.planner). Picks prefill and decode engines independently, each with 1 replica. The planner handles scaling at runtime.
Load Match
Triggered when a target load is specified (workload.requestRate or workload.concurrency). Finds the configuration that serves the target load with the minimum number of GPUs under SLA.
Default
Triggered when there is no planner and no target load. Maximizes throughput for the available GPU budget under SLA.
Planner Integration
When the planner is enabled, the profiler emits aic_perf_model identity for the Rust engine perf shim whenever picked configs are available. The pre_deployment_sweeping_mode field controls optional bootstrap data:
optimization_target must be set to sla for enable_throughput_scaling and the planner’s ttft_ms/itl_ms SLA targets to take effect. The PlannerConfig default is throughput, which uses static queue/utilization thresholds: it silently flips enable_throughput_scaling to false (so pre-deployment profiling is skipped and planner-profile-data-XXXX is not emitted) and ignores any features.planner.ttft_ms/itl_ms values. enable_load_scaling is unaffected (easy-mode keeps load scaling enabled). See the Planner Guide for the full explanation of each optimization_target value.
- rapid: Uses AIC simulation to generate interpolation curves (~30s, no GPUs). Consumers use AIC performance-model flags, planner
aic_perf_model, or in-process interpolation, soplanner-profile-data-XXXXis not emitted. - thorough: Deploys the selected engine config on real GPUs and sweeps across ISL/concurrency ranges (2-4h). When profile data is needed, the profiler packages it into
planner-profile-data-XXXX. - none: Skips interpolation. Planner throughput scaling can still start from native AIC or live FPM regression warmup. Mocker still requires pre-deployment sweeping.
The generated DGD can include these ConfigMaps:
- planner-config-XXXX: Serialized
PlannerConfigJSON (withaic_perf_modelwhen available andprofile_results_dirpointing to the profiling data mount) - planner-profile-data-XXXX: Prefill and decode interpolation data (JSON). Only emitted when
pre_deployment_sweeping_mode: thoroughand eitheroptimization_target: slais set alongsideenable_throughput_scaling: true, or mocker is enabled. Rapid mode does not emit this ConfigMap.
See the Planner Guide for the full PlannerConfig reference.
Mocker
When features.mocker.enabled: true, the profiler outputs a mocker DGD that simulates engine behavior without real GPUs. This is useful for testing planner behavior and validating configurations at scale.
Mocker requires pre-deployment sweeping to generate simulated performance profiles — pre_deployment_sweeping_mode cannot be none when mocker is enabled.
Gate Checks and Constraints
The profiler enforces these rules at startup:
Support Matrix
The profiler sweeps over the following parallelization mappings for prefill and decode:
Exact model x parallelization mapping support is dependent on the backend. The profiler does not guarantee that the recommended P/D engine configuration is supported and bug-free by the backend.
Deployment
Kubernetes Deployment (DGDR)
The recommended deployment method is through DGDRs. See Profiler Examples for complete DGDR YAML examples covering rapid, thorough, MoE, custom SLA, and override use cases.
Container Images
Each DGDR requires a container image for profiling and deployment:
image(Optional): Container image for the profiling job. Must contain the profiler code and dependencies.
Quick Start: Deploy with DGDR
Step 1: Create Your DGDR
Use a sample configuration or create your own:
Step 2: Apply the DGDR
Step 3: Monitor Progress
DGDR Status Phases:
Pending: Initial state, preparing to profileProfiling: Running profiling job (20-30 seconds for AIC, 2-4 hours for online)Ready: Profiling complete, generated DGD spec available in statusDeploying: Generating and applying DGD configurationDeployed: DGD successfully deployed and runningFailed: Error occurred (check events for details)
Step 4: Access Your Deployment
DGDRs are immutable. To update SLAs or configuration, delete the existing DGDR and create a new one.
Profiling Method
The profiler follows a 5-step process:
- Hardware Setup: Uses defaults or user-specified hardware configuration. Optionally, cluster-scoped operators can enable automatic GPU discovery to detect specifications from cluster nodes.
- Identify Sweep Ranges: Automatically determine minimum and maximum number of GPUs per engine. Minimum is determined by the model size and GPU VRAM. Maximum is set to one node for dense models and 4 nodes for MoE models.
- Parallelization Mapping Sweep: Test performance of engines with different parallelization mappings using the input ISL and OSL.
- For dense models, test different TP sizes for both prefill and decode.
- For MoE models (SGLang), evaluate both TEP and DEP as candidates for prefill and decode.
- Prefill:
- TP/TEP: Measure TTFT with batch size = 1 (assuming ISL is long enough to saturate compute) without KV reuse.
- DEP: Attention uses data parallelism. Send a single burst with total concurrency
attention_dp_size × attn_dp_num_req_ratio(defaults to 4) and compute the reported TTFT astime_to_first_token.max / attn_dp_num_req_ratiofrom the AIPerf summary of that burst.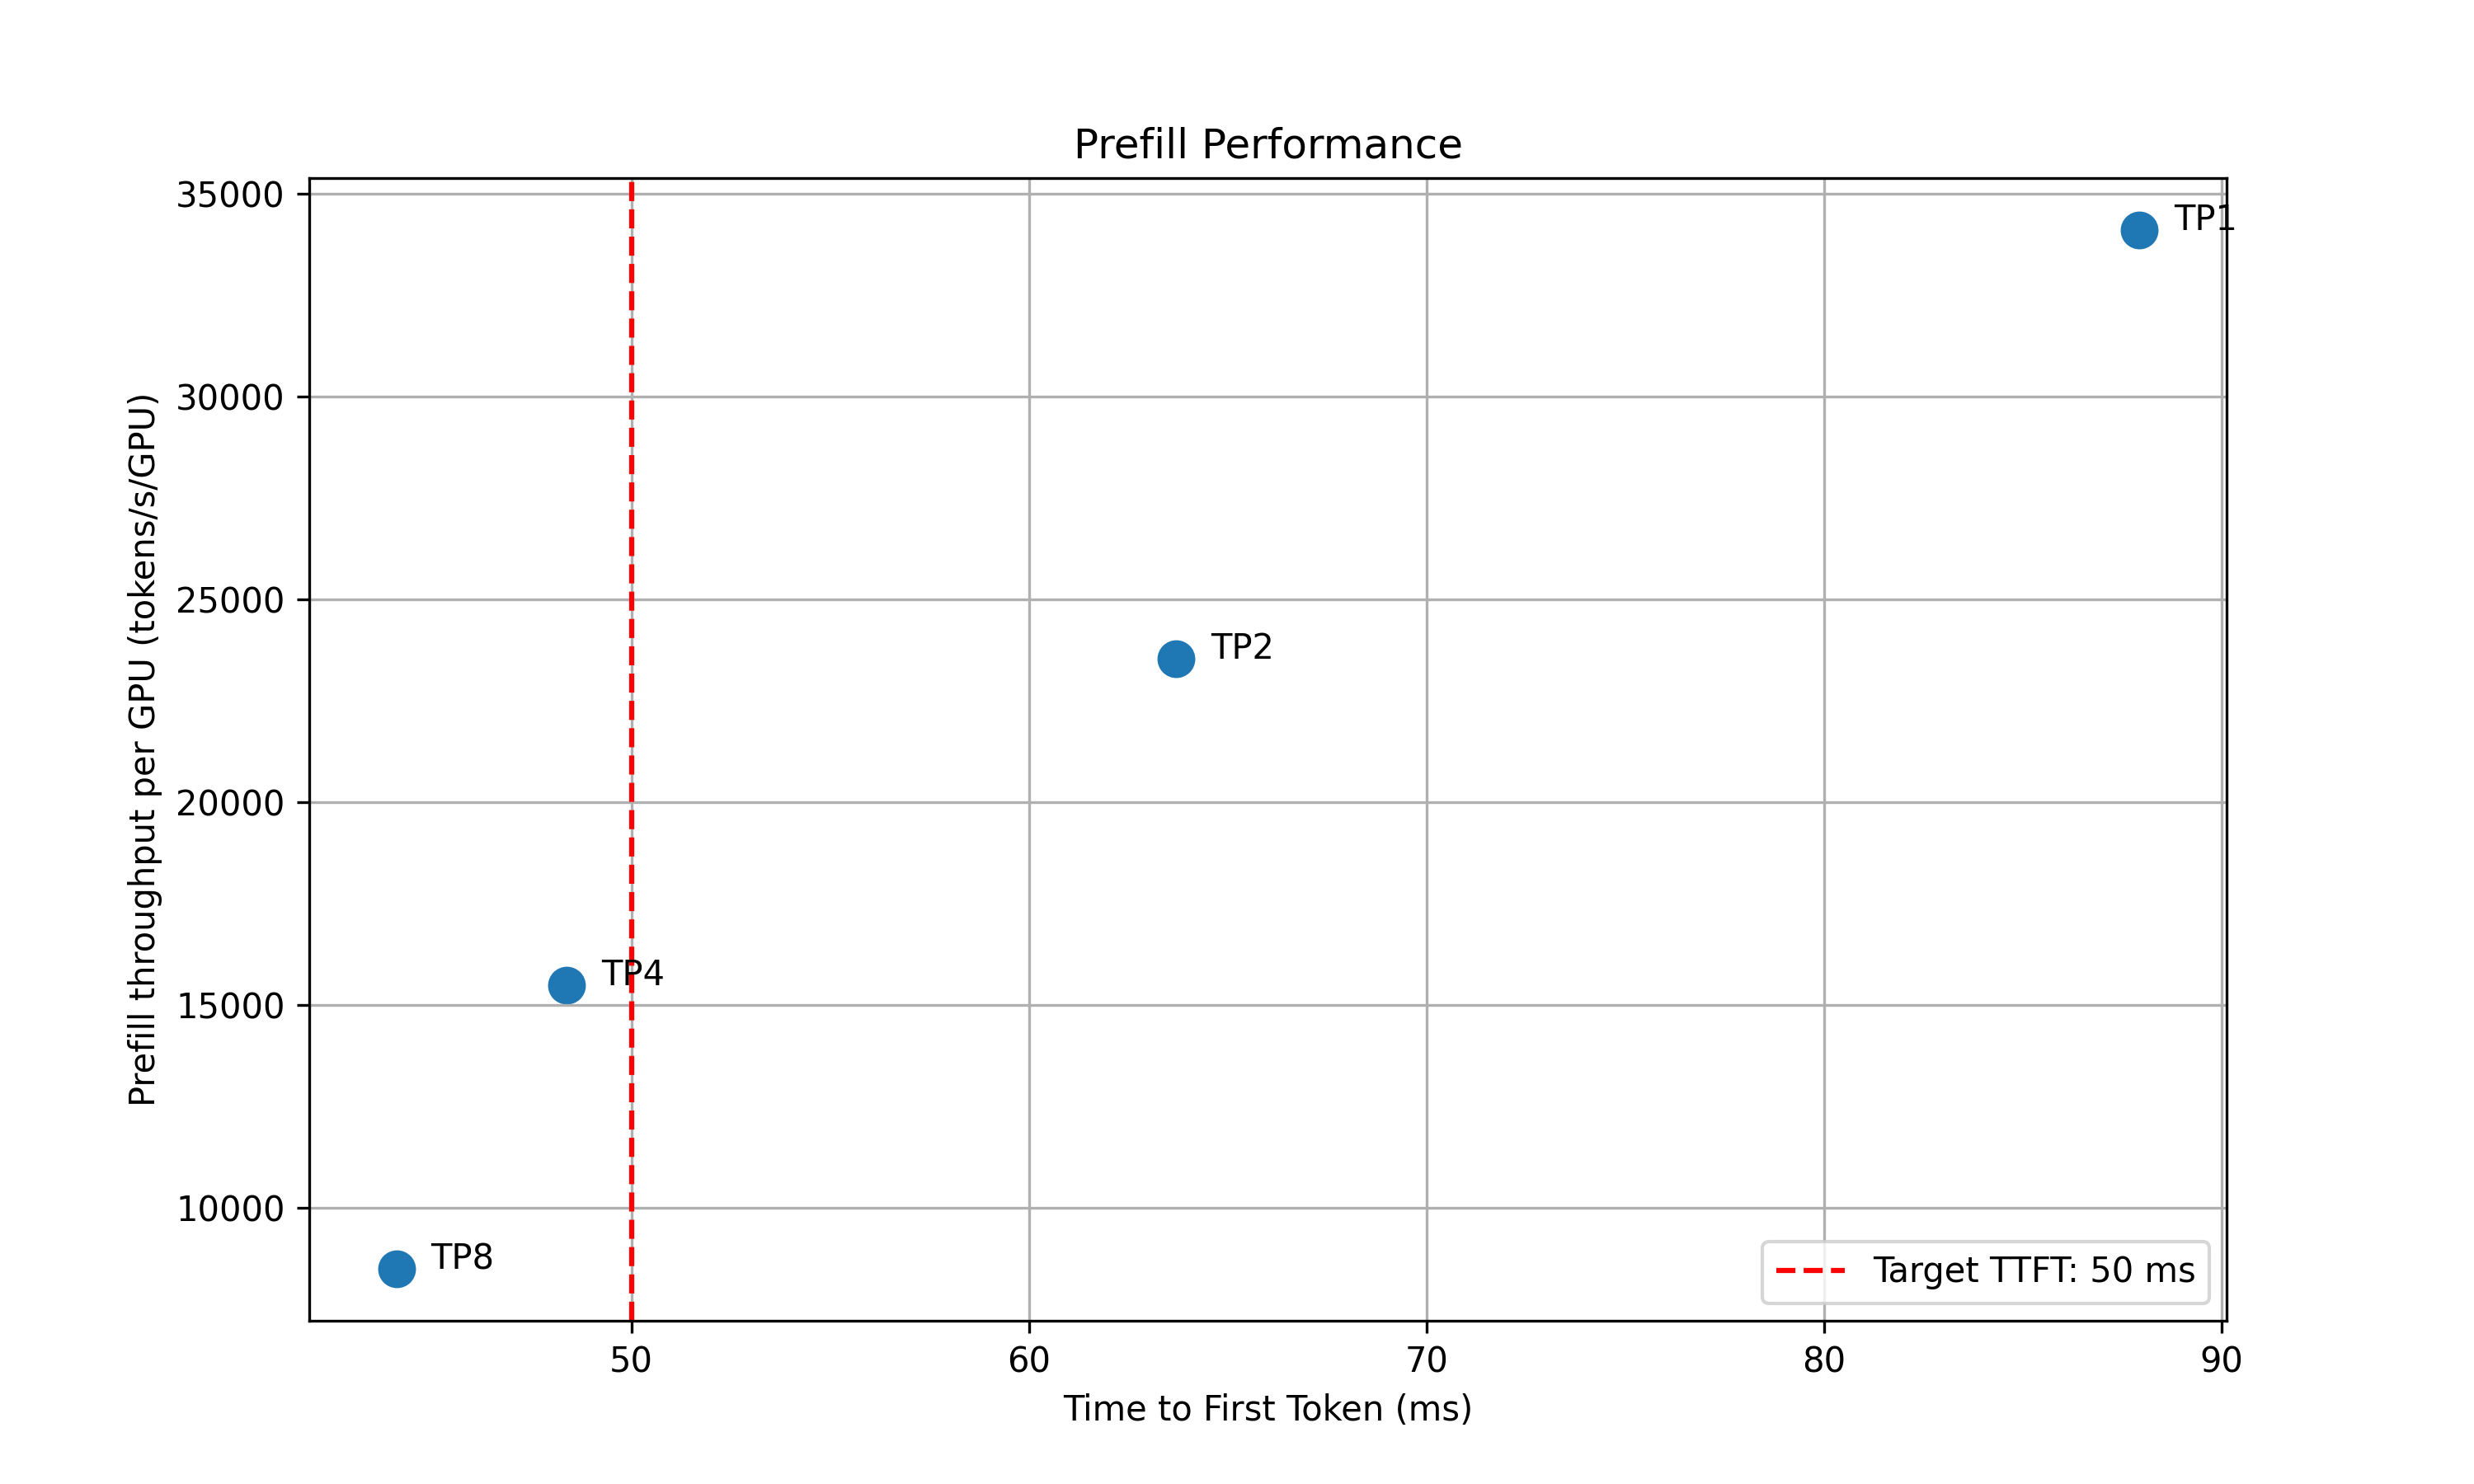
- Decode: Measure the ITL under different numbers of in-flight requests, from 1 to the maximum the KV cache can hold. To measure ITL without being affected by piggy-backed prefill requests, the script enables KV-reuse and warms up the engine by issuing the same prompts before measuring.
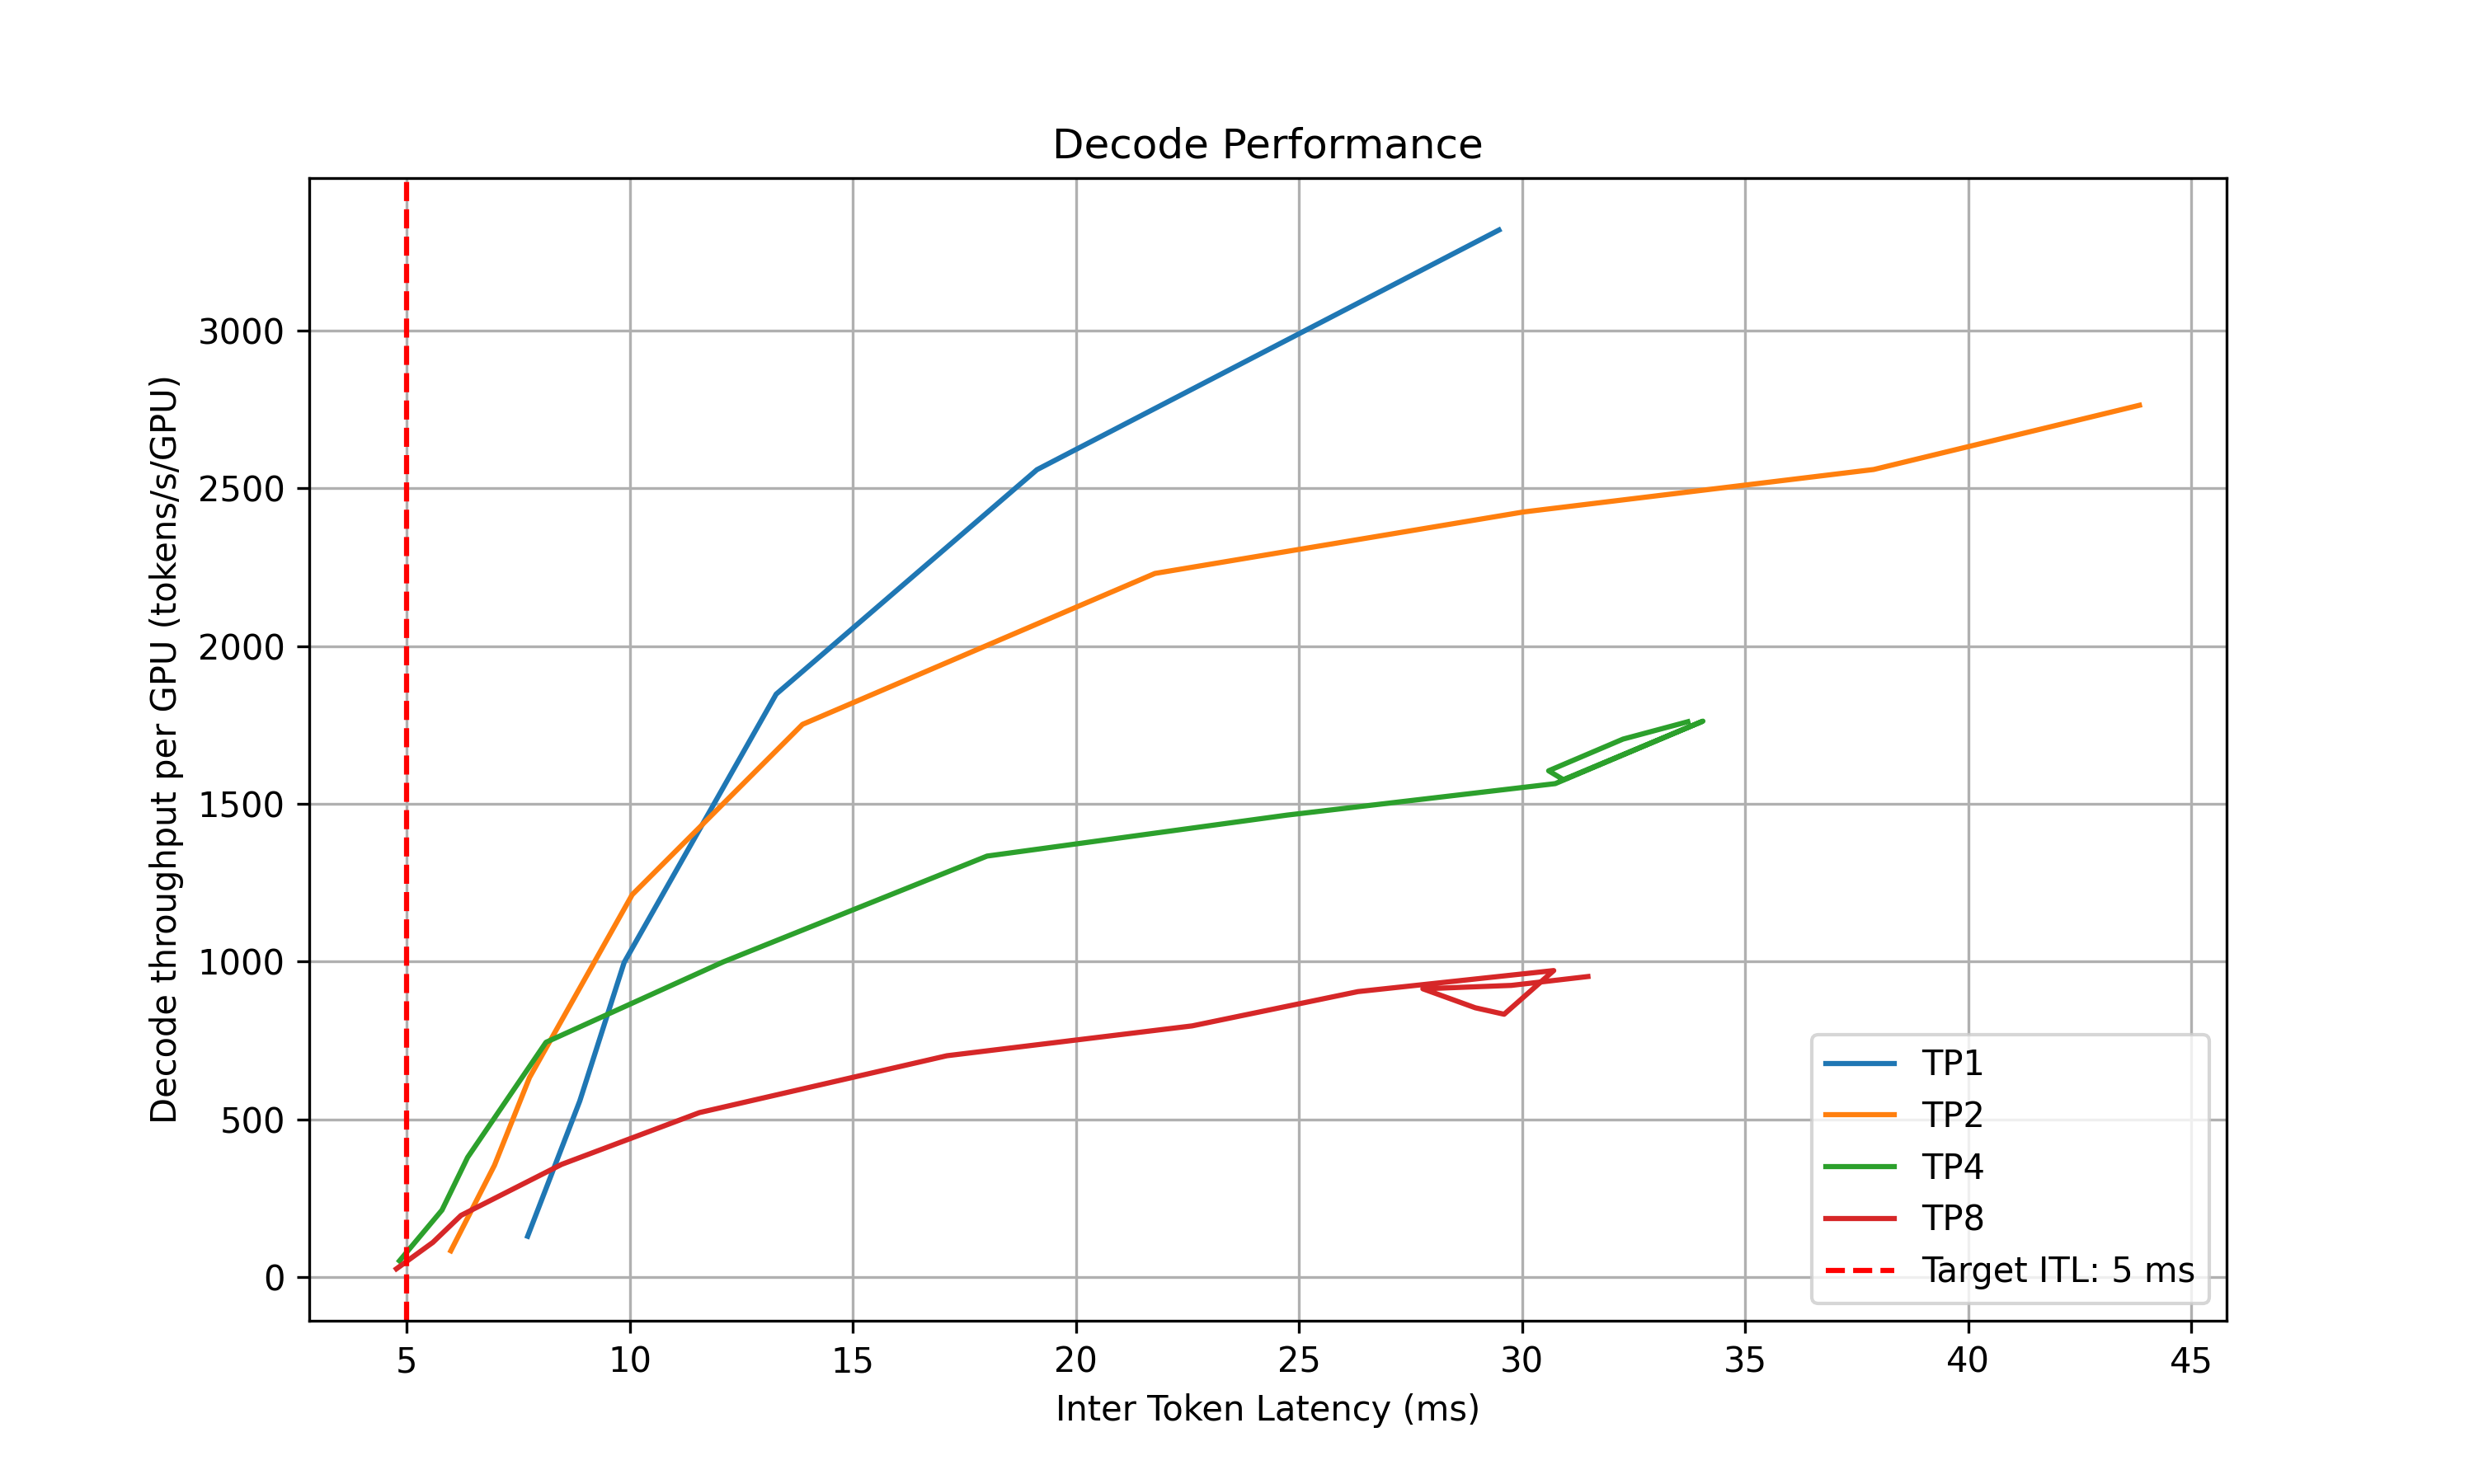
- Recommendation: Select optimal parallelization mapping for prefill and decode that achieves the highest per-GPU throughput while adhering to the SLA on TTFT and ITL.
- In-Depth Profiling on the Recommended P/D Engine: Interpolate TTFT with ISL and ITL with active KV cache and decode context length for more accurate performance estimation.
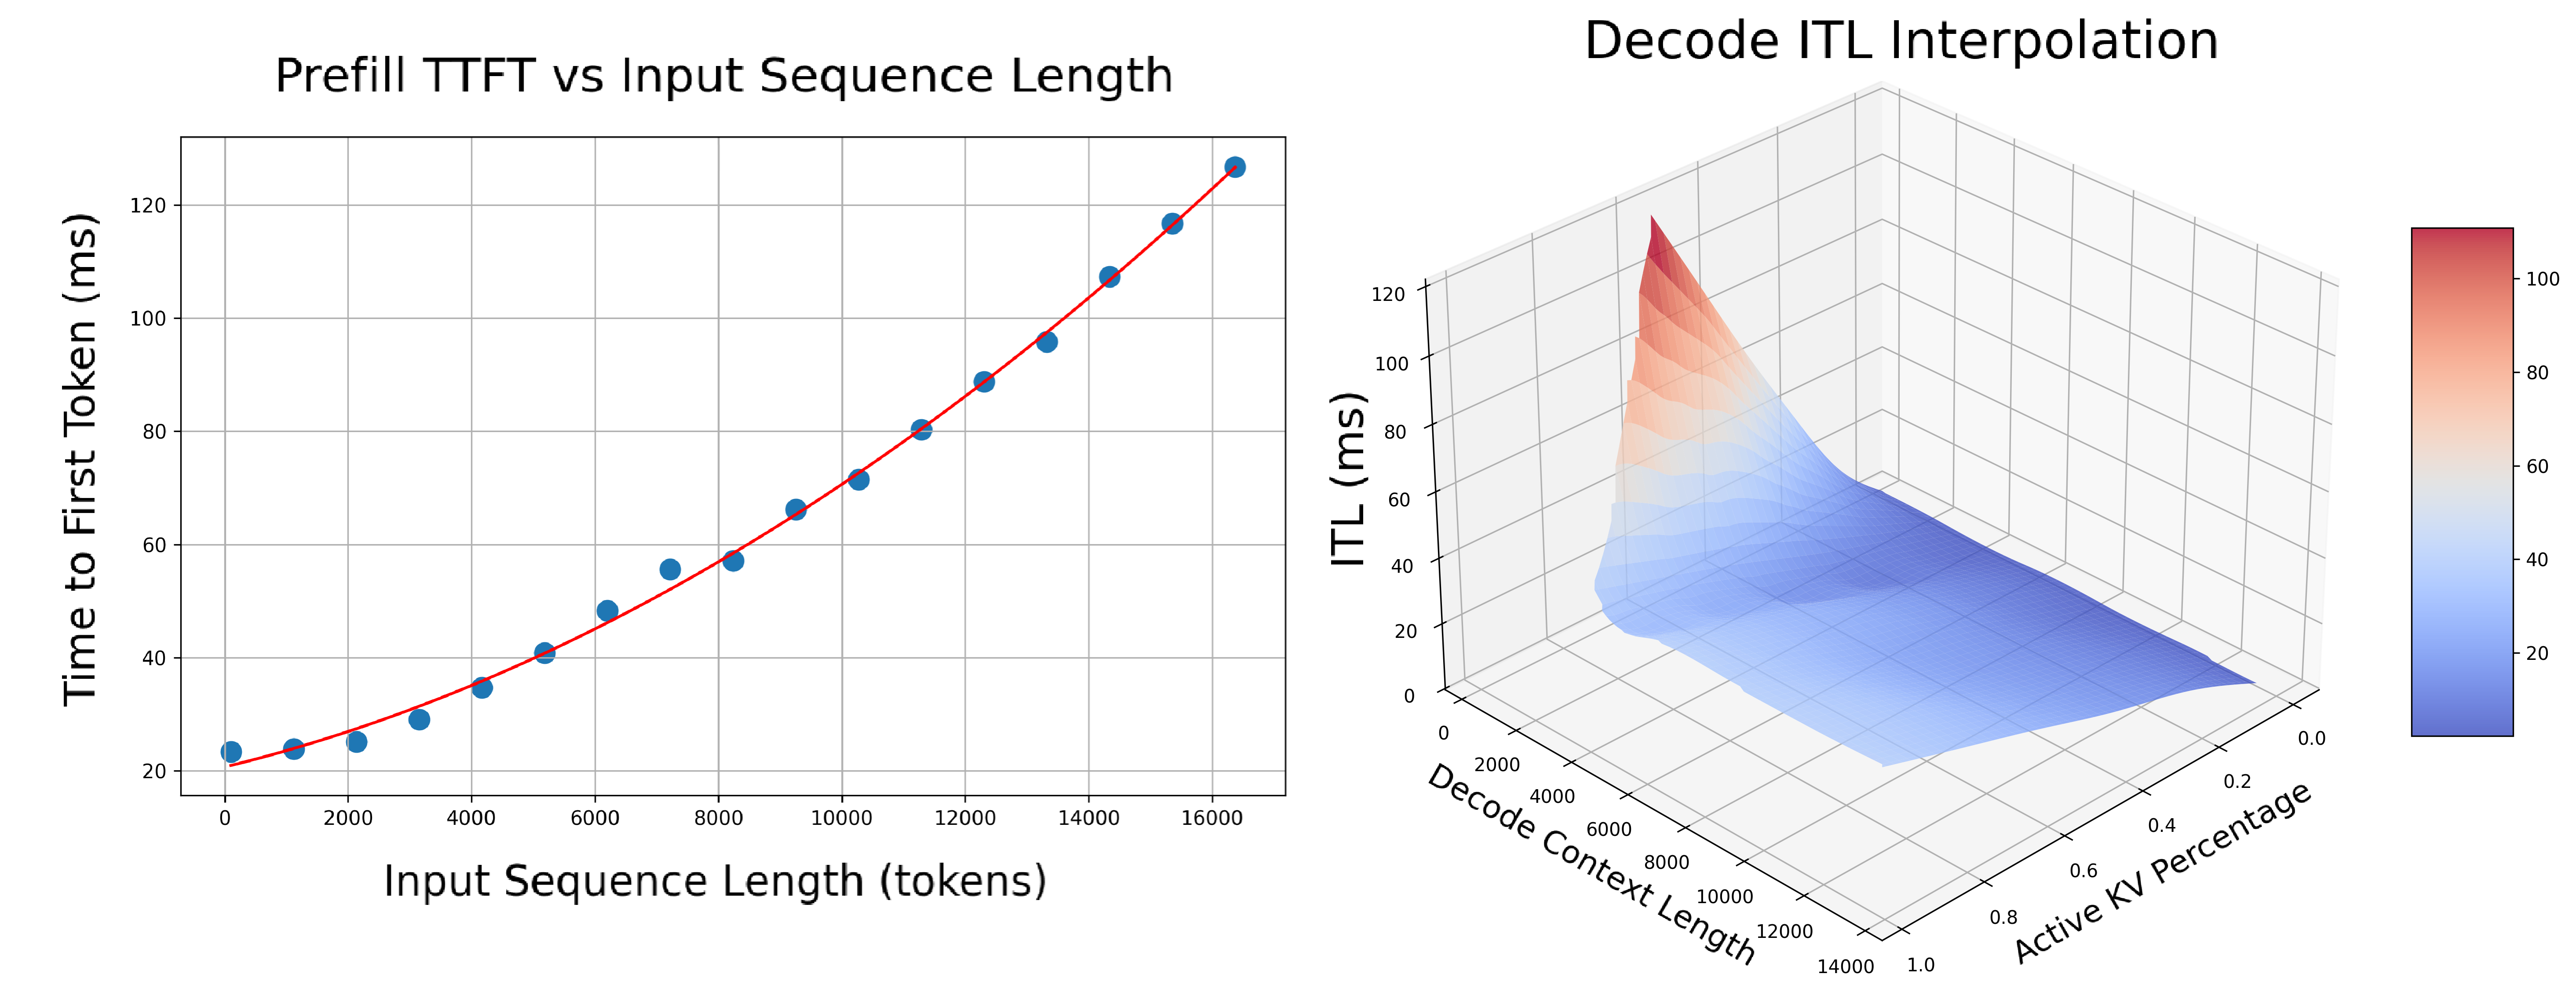
- Prefill: Measures TTFT and throughput per GPU across different input lengths with batch size=1.
- Decode: Measures ITL and throughput per GPU under various KV cache loads and decode context lengths.
AIPerf on Real Engines
Profiles your model by creating real test deployments in Kubernetes and measuring their performance.
- Duration: 2-4 hours
- Accuracy: Highest (real measurements)
- GPU Requirements: Full access to test different parallelization mappings
- Backends: vLLM, SGLang, TensorRT-LLM
AIPerf-based profiling is the default behavior. Use searchStrategy: thorough for comprehensive real-engine profiling:
AI Configurator Simulation
Uses performance simulation to rapidly estimate optimal configurations without running real deployments.
- Duration: 20-30 seconds
- Accuracy: Estimated (may have errors for unusual configurations)
- GPU Requirements: None
- Backends: All (vLLM, SGLang, TensorRT-LLM)
AI Configurator is used by default with searchStrategy: rapid:
aicBackendVersion specifies the TensorRT-LLM version that AI Configurator simulates. See the AI Configurator supported features for available versions.
Currently supports:
- Backends: vLLM, SGLang, TensorRT-LLM
- Systems: H100 SXM, H200 SXM, B200 SXM, GB200 SXM, A100 SXM
- Models: Wide range including GPT, Llama, Mixtral, DeepSeek, Qwen, and more
See AI Configurator documentation for the full list.
Automatic GPU Discovery
The operator automatically discovers GPU resources from cluster nodes, providing hardware info (GPU model, VRAM, GPUs per node) and automatic profiling search space calculation.
Requirements:
- Cluster-scoped operators (recommended): Have node read permissions by default. GPU discovery works automatically.
DEPRECATED: The following applies only to namespace-scoped operators, which are deprecated and will be removed in a future release. Use cluster-wide mode for new deployments.
- Namespace-scoped operators (deprecated): GPU discovery is enabled by default when installing via Helm — the chart provisions the required ClusterRole/ClusterRoleBinding automatically
For namespace-scoped operators (deprecated), GPU discovery is controlled by a Helm value:
If GPU discovery is disabled, provide hardware config manually in the DGDR:
If GPU discovery is disabled and no manual hardware config is provided, the DGDR will be rejected at admission time.
Configuration
DGDR Configuration Structure
All profiler configuration is provided through the v1beta1 DGDR spec fields:
SLA Configuration (Optional)
- ISL/OSL: Based on your expected traffic patterns
- TTFT: First token latency target (lower = more GPUs needed, affects prefill engine)
- ITL: Token generation latency target (lower = more GPUs needed, affects decode engine)
- Trade-offs: Tighter SLAs require more GPU resources
Hardware Configuration (Optional)
- numGpusPerNode: Determine the upper bound of GPUs per node for dense models and configure Grove for multi-node MoE engines
- gpuSku: GPU SKU identifier, auto-detected by the controller
If you don’t specify hardware constraints, the controller auto-detects based on your model size and available cluster resources.
Search Strategy (Optional)
Controls the profiling search depth:
- rapid: Performs a fast sweep over parallelization mappings (default)
- thorough: Explores more configurations for potentially better results
Planner Configuration (Optional)
Pass arguments to the SLA planner via the features section:
Planner arguments use the PlannerConfig field names consumed by the planner service. See SLA Planner documentation for full list.
Model Cache PVC (Advanced)
For large models, use a pre-populated PVC containing model weights instead of downloading from HuggingFace:
Requirements:
- The PVC must exist in the same namespace as the DGDR
- The model weights must be accessible at
{mountPath}/{pvcPath}
Engine Configuration (Auto-configured)
The controller automatically handles model and backend configuration from high-level fields:
You should not manually set model or backend in profiling config overrides.
Using Existing DGD Configs
Provide a base DGD config via the overrides section:
The profiler uses the DGD config as a base template, then optimizes it based on your SLA targets.
Integration
With SLA Planner
The Profiler generates interpolation data that the SLA Planner uses for autoscaling decisions.
Prefill Interpolation (selected_prefill_interpolation/raw_data.npz):
prefill_isl: 1D array of input sequence lengths testedprefill_ttft: 1D array of TTFTs (ms) at each ISLprefill_thpt_per_gpu: 1D array of throughput (tokens/s/GPU) at each ISL
Decode Interpolation (selected_decode_interpolation/raw_data.npz):
max_kv_tokens: Total KV tokens capacity in decode enginex_kv_usage: 1D array of active KV usage percentages [0, 1]y_context_length: 1D array of average context lengths testedz_itl: 1D array of ITLs (ms) at each (KV usage, context length) pointz_thpt_per_gpu: 1D array of throughput (tokens/s/GPU) at each point
With Dynamo Operator
When using DGDR, the Dynamo Operator:
- Creates profiling jobs automatically
- Stores profiler output in ConfigMaps (
dgdr-output-<name>and, when thorough profile data is needed,planner-profile-data) - Generates optimized DGD configurations
- Deploys the DGD with SLA Planner integration
Failure Handling
Profiling failures are not retried at the Kubernetes Job level (backoffLimit: 0).
Most profiler errors — validation failures, unsupported model/hardware combinations,
missing configs — are deterministic and will never succeed on retry, so re-running
the full profiling cycle would only waste GPU time.
When the profiler reports failure, the output-copier sidecar writes the error
details (phase, error message, profiler status) to the output ConfigMap and exits
successfully. The DGDR controller reads the failure from the ConfigMap and
transitions the DGDR directly to the Failed phase with the specific sub-phase
failure reason (e.g., SweepingDecodeFailed, GeneratingDGDFailed). Use
kubectl describe dgdr <name> to see the failure details in the conditions.
The generated DGD is tracked via labels:
With Observability
Monitor profiling jobs:
Advanced Topics
Manual Deployment Control
Disable auto-deployment to review the generated DGD before applying:
Then manually extract and apply:
Mocker Deployment
Deploy a mocker deployment that simulates engines without GPUs:
With thorough sweeping, profiling still runs against the real backend to collect performance data and stores it in planner-profile-data. With rapid sweeping, the mocker uses AIC performance-model flags instead of a profile-data ConfigMap. Useful for large-scale experiments, testing Planner behavior, and validating configurations.
Accessing Profiling Artifacts
By default, profiler output is stored in ConfigMaps. For detailed artifacts (plots, logs, raw data), attach a PVC via overrides:
ConfigMaps:
dgdr-output-<name>: Generated DGD configurationplanner-profile-data: Profiling data for Planner and mocker consumers (JSON). Only created for thorough sweeping when profile data is needed.
PVC artifacts (optional):
- Performance plots (PNGs)
- DGD configurations for each profiled deployment
- AIPerf profiling artifacts
- Raw profiling data (
.npzfiles) - Profiler logs
Access PVC results:
Output Performance Plots
The profiler generates plots to visualize performance data:
Parallelization Mapping Sweep Plots:
prefill_performance.png: TTFT vs Parallelization Mapping sizedecode_performance.png: ITL vs Parallelization Mapping size and in-flight requests
In-Depth Profiling Plots:
selected_prefill_interpolation/prefill_ttft_interpolation.png: TTFT vs ISLselected_prefill_interpolation/prefill_throughput_interpolation.png: Throughput vs ISLselected_decode_interpolation/decode_itl_interplation.png: ITL vs KV usage and context lengthselected_decode_interpolation/decode_throughput_interpolation.png: Throughput vs KV usage and context length
Runtime Profiling (SGLang)
SGLang workers expose profiling endpoints for runtime performance analysis:
View traces using Chrome’s chrome://tracing, Perfetto UI, or TensorBoard.
Troubleshooting
SLA Cannot Be Met
The profiler logs a warning and updates the SLA to the best achievable value. To improve results:
- Relax SLA targets (increase TTFT/ITL)
- Add more GPU resources
- Try a different backend
- Use a smaller or quantized model
Profiling Takes Too Long
- Use
searchStrategy: rapidfor ~30s profiling - Reduce interpolation granularity
- Reduce the GPU search space via hardware constraints
Out of Memory During Profiling
- Reduce
max_batch_sizein engine config - Skip larger TP configurations by constraining hardware
- Use a quantized model variant
Image Pull Errors
Ensure image pull secrets are configured in your namespace for the container registry.
See Also
- Profiler README — Quick overview and feature matrix
- Profiler Examples — Complete DGDR YAML examples
- Planner Guide — PlannerConfig reference and scaling modes
- DGDR API Reference — Full DGDR specification