

Metrics
Overview
This guide provides a walkthrough for collecting and visualizing metrics from Dynamo components using the kube-prometheus-stack. The kube-prometheus-stack provides a powerful and flexible way to configure monitoring for Kubernetes applications through custom resources like PodMonitors, making it easy to automatically discover and scrape metrics from Dynamo components.
Prerequisites
Install kube-prometheus-stack
If you don’t have an existing Prometheus setup, you’ll likely want to install the kube-prometheus-stack. This is a collection of Kubernetes manifests that includes the Prometheus Operator, Prometheus, Grafana, and other monitoring components in a pre-configured setup. The stack introduces custom resources that make it easy to deploy and manage monitoring in Kubernetes:
PodMonitor: Automatically discovers and scrapes metrics from pods based on label selectorsServiceMonitor: Similar to PodMonitor but works with ServicesPrometheusRule: Defines alerting and recording rules
For a basic installation:
[!Note] The commands enumerated below assume you have installed the kube-prometheus-stack with the installation method listed above. Depending on your installation configuration of the monitoring stack, you may need to modify the
kubectlcommands that follow in this document accordingly (e.g modifying Namespace or Service names accordingly).
Install Dynamo Operator
Before setting up metrics collection, you’ll need to have the Dynamo operator installed in your cluster. Follow our Installation Guide for detailed instructions on deploying the Dynamo operator.
Make sure to set the prometheusEndpoint to the Prometheus endpoint you installed in the previous step.
Node Exporter for CPU/Memory Metrics
The Dynamo Grafana dashboard includes panels for node-level CPU utilization, system load, and container resource usage. These metrics are collected and exported to Prometheus via node-exporter, which exposes hardware and OS metrics from Linux systems.
[!Note] The kube-prometheus-stack installation described above includes node-exporter by default. If you’re using a custom Prometheus setup, you’ll need to ensure node-exporter is deployed as a DaemonSet on your cluster nodes.
To verify node-exporter is running:
If node-exporter is not running, you can install it via the kube-prometheus-stack or deploy it separately. For more information, see the node-exporter documentation.
DCGM Metrics Collection (Optional)
GPU utilization metrics are collected and exported to Prometheus via dcgm-exporter. The Dynamo Grafana dashboard includes a panel for GPU utilization related to your Dynamo deployment. For that panel to be populated, you need to ensure that the dcgm-exporter is running in your cluster. To check if the dcgm-exporter is running, please run the following command:
If the output is empty, you need to install the dcgm-exporter. For more information, please consult the official dcgm-exporter documentation.
Deploy a DynamoGraphDeployment
Let’s start by deploying a simple vLLM aggregated deployment:
This will create two components:
- A Frontend component exposing metrics on its HTTP port
- A Worker component exposing metrics on its system port
Both components expose a /metrics endpoint following the OpenMetrics format, but with different metrics appropriate to their roles. For details about:
- Deployment configuration: See the vLLM README
- Available metrics: See the metrics guide
Validate the Deployment
Let’s send some test requests to populate metrics:
For more information about validating the deployment, see the vLLM README.
Set Up Metrics Collection
Create PodMonitors
The Prometheus Operator uses PodMonitor resources to automatically discover and scrape metrics from pods. To enable this discovery, the Dynamo operator automatically creates PodMonitor resource and adds these labels to all pods:
nvidia.com/metrics-enabled: "true"- Enables metrics collectionnvidia.com/dynamo-component-type: "frontend|worker"- Identifies the component type
You can opt-out specific deployments from metrics collection by adding this annotation to your DynamoGraphDeployment:
Configure Grafana Dashboard
Apply the Dynamo dashboard configuration to populate Grafana with the Dynamo dashboard:
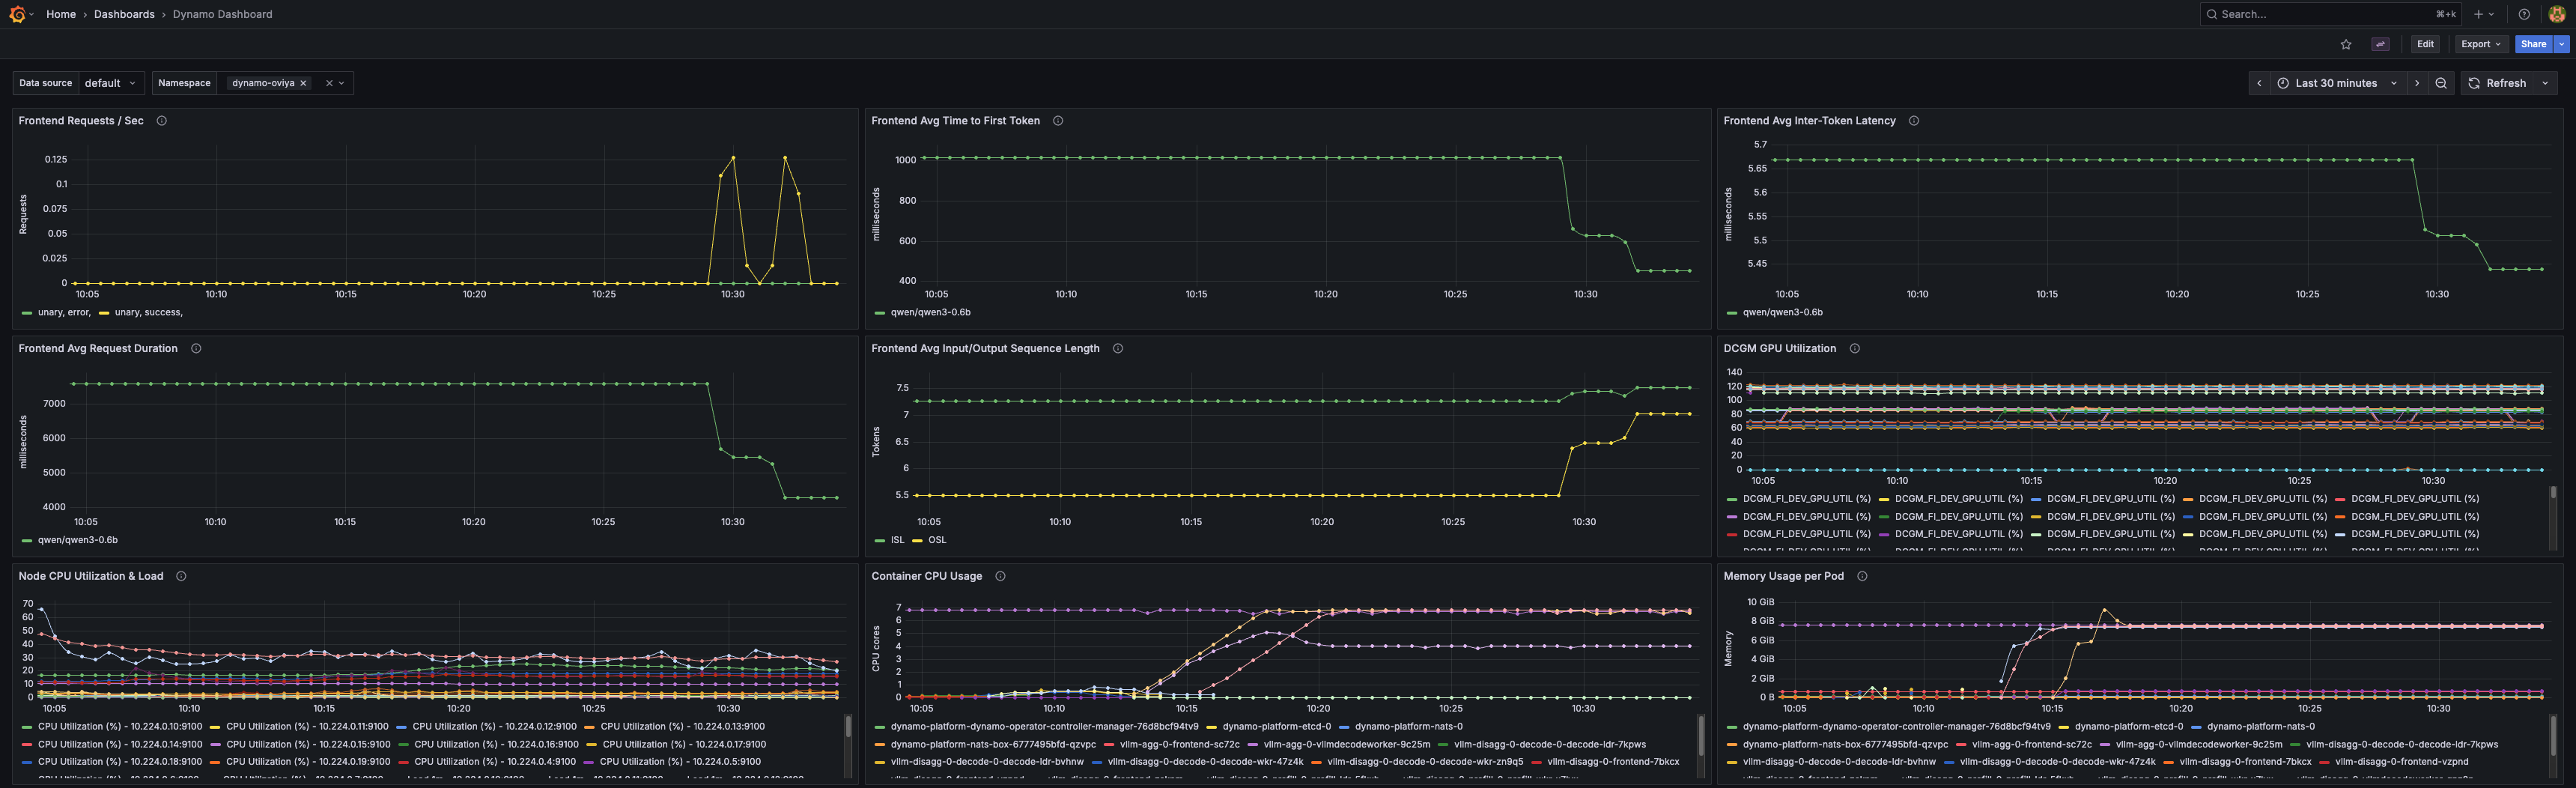
The dashboard is embedded in the ConfigMap. Since it is labeled with grafana_dashboard: "1", the Grafana will discover and populate it to its list of available dashboards. The dashboard includes panels for:
- Frontend request rates
- Time to first token
- Inter-token latency
- Request duration
- Input/Output sequence lengths
- GPU utilization via DCGM
- Node CPU utilization and system load
- Container CPU usage per pod
- Memory usage per pod
Viewing the Metrics
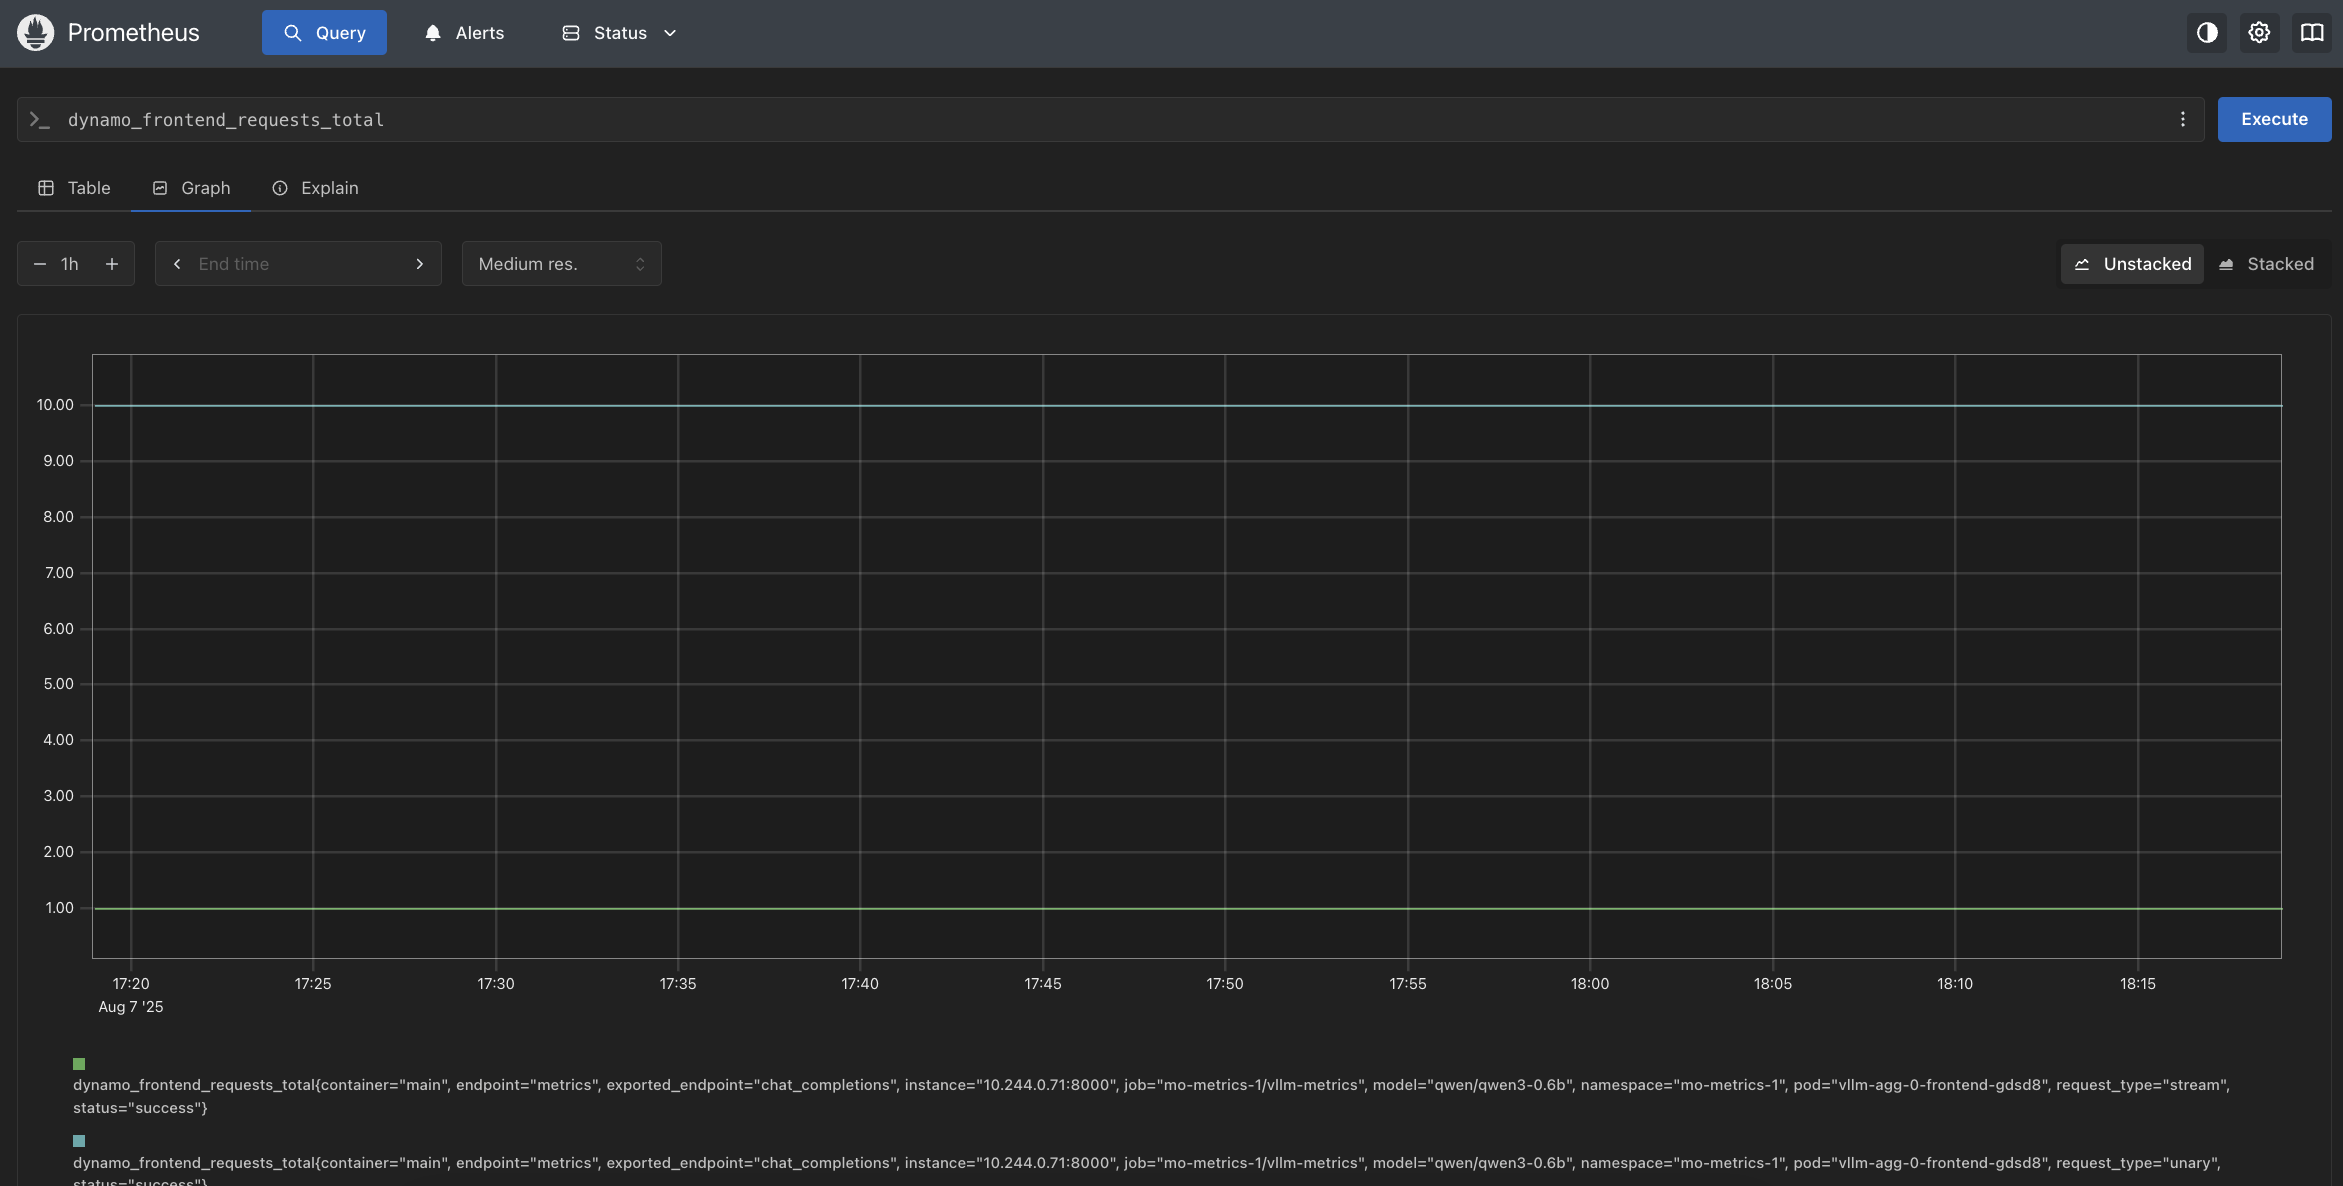
In Prometheus
Visit http://localhost:9090 and try these example queries:
dynamo_frontend_requests_totaldynamo_frontend_time_to_first_token_seconds_bucket
In Grafana
Visit http://localhost:3000 and log in with the credentials captured above.
Once logged in, find the Dynamo dashboard under General.
Operator Metrics
Note: The metrics described above are for Dynamo applications (frontends, workers). The Dynamo Operator itself also exposes metrics for monitoring controller reconciliation, webhook validation, and resource inventory.
See the Operator Metrics Guide for details on operator-specific metrics and the operator dashboard.