

Metrics Visualization with Prometheus and Grafana
Overview
This guide shows how to set up Prometheus and Grafana for visualizing Dynamo metrics on a single machine for demo purposes.
Components:
- Prometheus Server - Collects and stores metrics from Dynamo services
- Grafana - Provides dashboards by querying the Prometheus Server
For metrics reference, see Metrics Documentation.
Environment Variables
Getting Started Quickly
This is a single machine example.
Start the Observability Stack
Start the observability stack (Prometheus, Grafana, Tempo, exporters). See Observability Getting Started for instructions and prerequisites.
Start Dynamo Components
Start frontend and worker (a simple single GPU example):
After the workers are running, send a few test requests to populate metrics in the system:
After sending a few requests, the Prometheus Exposition Format text metrics are available at:
- Frontend:
http://localhost:8000/metrics - Backend worker:
http://localhost:8081/metrics
Access Web Interfaces
Once Dynamo components are running:
- Open Grafana at
http://localhost:3000(username:dynamo, password:dynamo) - Click on Dashboards in the left sidebar
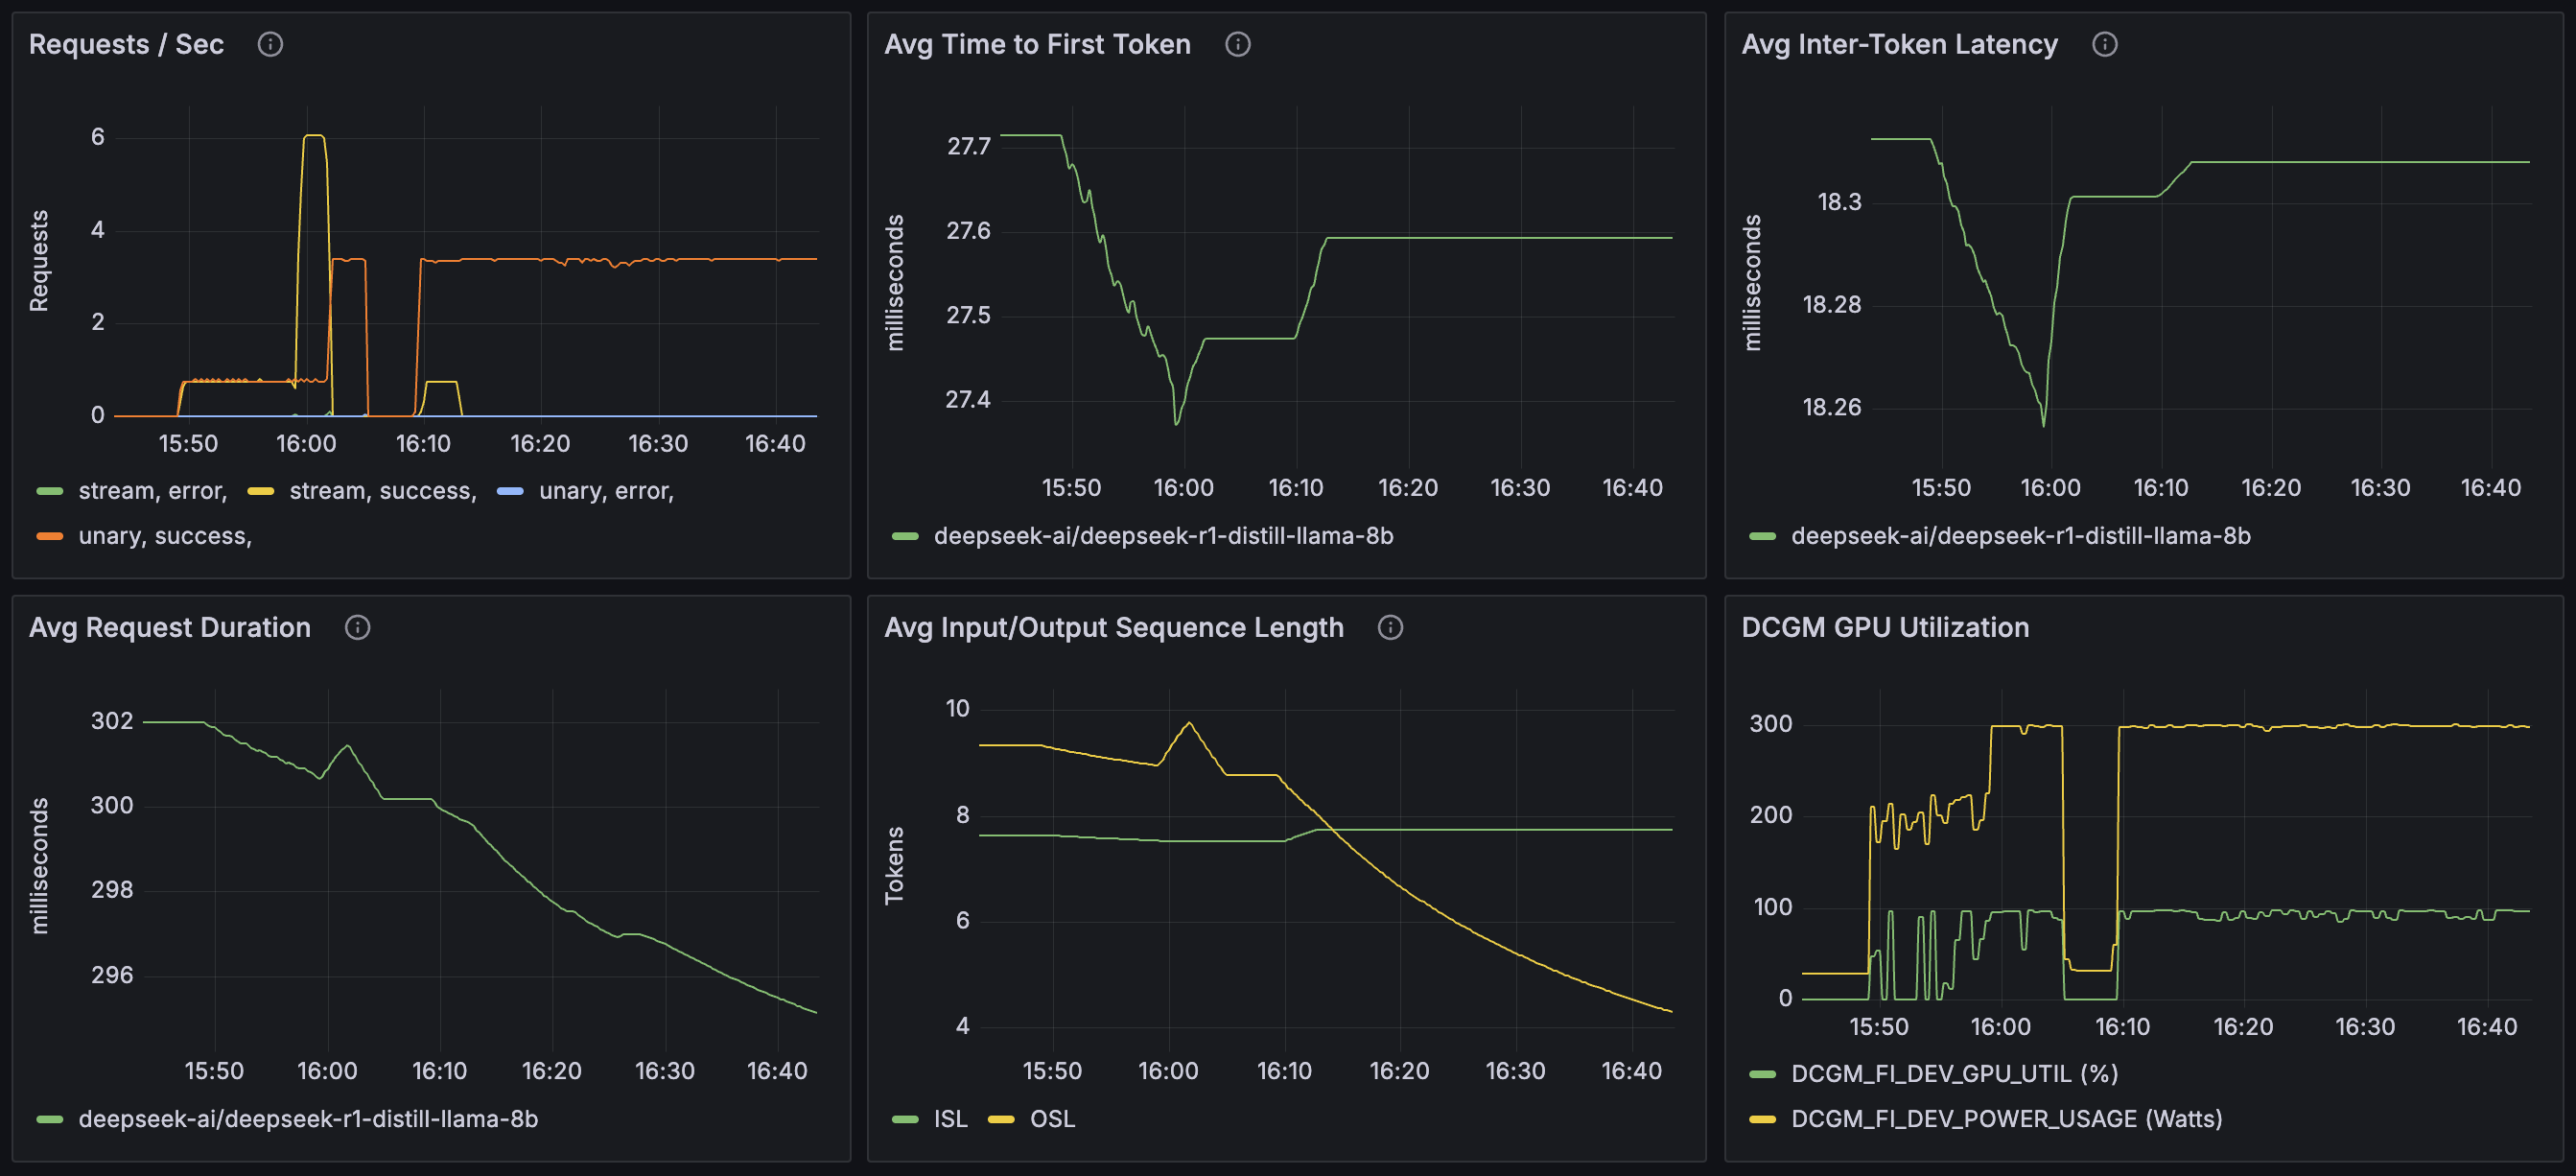
- Select Dynamo Dashboard to view metrics and traces
Other interfaces:
- Prometheus:
http://localhost:9090 - Tempo (tracing): Accessible through Grafana’s Explore view. See Tracing Guide for details.
Note: If accessing from another machine, replace localhost with the machine’s hostname or IP address, and ensure firewall rules allow access to these ports (3000, 9090).
Configuration
Prometheus
The Prometheus configuration is specified in prometheus.yml. This file is set up to collect metrics from the metrics aggregation service endpoint.
Please be aware that you might need to modify the target settings to align with your specific host configuration and network environment.
After making changes to prometheus.yml, restart the Prometheus service. See Observability Getting Started for Docker Compose commands.
Grafana
Grafana is pre-configured with:
- Prometheus datasource
- Sample dashboard for visualizing service metrics
Troubleshooting
-
Verify services are running using
docker compose ps -
Check logs using
docker compose logs -
Check Prometheus targets at
http://localhost:9090/targetsto verify metric collection. -
If you encounter issues with stale data or configuration, stop services and wipe volumes using
docker compose down -vthen restart.
Note: The -v flag removes named volumes (grafana-data, tempo-data), which will reset dashboards and stored metrics.
For specific Docker Compose commands, see Observability Getting Started.
Developer Guide
For detailed information on creating custom metrics in Dynamo components, see: