

Planner Design
![]()
Tier 3 design documentation for contributors and architects. For user-facing docs, see docs/components/planner/.
Overview
The Planner is Dynamo’s autoscaling controller. It supports two scaling modes: throughput-based (using profiling data and traffic prediction) and load-based (using real-time engine metrics and online regression). This document covers the internal architecture, algorithms, and design trade-offs for both modes.
Runtime Pipeline
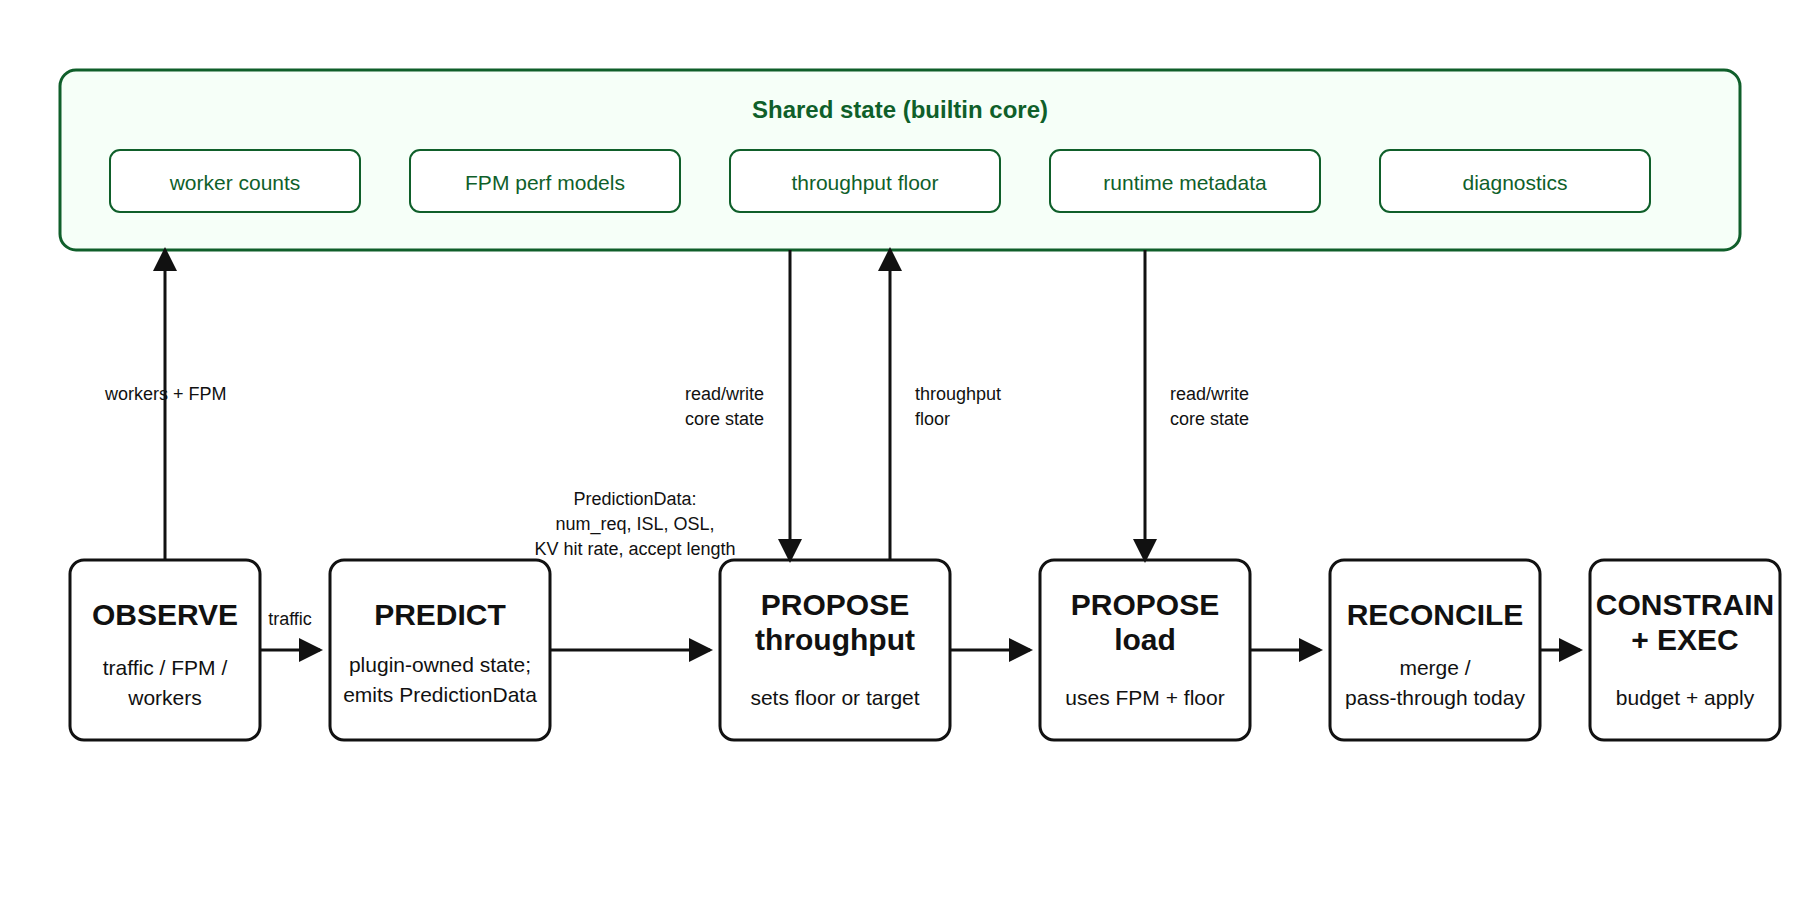
The runtime planner is driven by OrchestratorEngineAdapter, which wraps the
local scaling algorithms as builtin plugins and runs the same plugin pipeline
used by external gRPC plugins.
- OBSERVE:
NativePlannerBaseand the engine adapter collect worker counts, traffic metrics, and forward-pass metrics. Observations are exposed throughPipelineContext.observations. - PREDICT:
builtin_load_predictruns on the throughput interval. It consumes traffic observations and emits predicted request count, ISL, OSL, KV hit rate, and speculative accept length for this tick. - PROPOSE:
builtin_throughput_proposeconsumes same-tick predictions and updates the throughput lower bound.builtin_load_proposeconsumes FPM and worker observations and applies the load-based +/-1 scaling algorithm. - RECONCILE / CONSTRAIN: The generic pipeline merges proposals from
builtin and external plugins. After CONSTRAIN, the engine adapter applies
the local planner’s final
min_endpointand GPU-budget invariants before returning any scaling effect. - EXECUTE: The adapter returns
PlannerEffects.scale_to;NativePlannerBaseapplies those targets through the configured connector.
For compatibility with existing configs and DGDR-generated planner payloads,
load_adjustment_interval_seconds and throughput_adjustment_interval_seconds
still define the builtin plugin fire intervals. The base
scheduling.scale_interval_seconds defaults to the greatest common divisor of
those enabled intervals, so existing load and throughput fire times are preserved.
Why Two Scaling Loops?
The two builtin scaling loops serve different control horizons. Throughput-based scaling is the slower predictive capacity loop: it uses a longer traffic window, load prediction, and profiling or perf-model capacity estimates to provision for sustained demand. This avoids reacting to short-lived metric noise and gives scale-out enough time to complete before the predicted load arrives.
Load-based scaling is the faster reactive SLA-correction loop. It uses current FPM, queue, worker-count, and online perf-model observations to handle short-term overload, prediction or profiling error, runtime metadata changes such as KV hit rate or speculative accept length, and the actual state observed after previous scaling actions.
When both loops are enabled, throughput-based scaling sets the replica lower bound, and load-based scaling runs more frequently above that floor. This keeps capacity that was predicted for near-future demand from being removed because of short idle periods, while still allowing the planner to react faster than the throughput interval when real-time SLA pressure appears.
Builtin Shared State
The pipeline context is a per-tick data plane: observations, predictions, and
proposals are produced for the current tick and passed through the public plugin
API. The builtin local planner also needs cross-tick state to preserve existing
planner behavior. That state is kept in PlannerScalingState, which is private
to the builtin plugins and the engine adapter rather than exposed as a public
gRPC plugin contract.
PlannerScalingState stores:
- Worker inventory: current ready prefill/decode counts, expected counts, and whether a prefill or decode scale operation is still in progress.
- Perf models: prefill, decode, or aggregated
PlannerEnginePerfModelinstances, including pre-deployment benchmark FPMs and online FPM updates. - Throughput lower bounds: the current prefill/decode floor produced by throughput-based scaling. Load-based scaling can scale above this floor but cannot scale below it.
- Runtime metadata: last observed KV hit rate and speculative accept length. These use last-value semantics and are input features for capacity estimation.
- Per-tick diagnostics scratch: estimated TTFT/ITL, predicted traffic shape, engine RPS, decision reasons, lower bounds, and execution/audit metadata used by metrics and HTML reports.
- Worker capabilities and budget inputs: component GPU counts and runtime
capabilities used to clamp final targets to
min_endpointand GPU budgets.
Predictor history is intentionally not stored in PlannerScalingState.
builtin_load_predict owns the request-count, ISL, and OSL predictor state and
passes same-tick output through PredictionData. This keeps PREDICT -> PROPOSE
dependencies explicit while allowing the builtin proposer plugins to share the
state that is inherently cross-tick, such as perf-model fitting and throughput
floors.
Throughput-Based Scaling
Throughput-based scaling is implemented by two builtin plugins:
builtin_load_predict and builtin_throughput_propose.
Step 1: Traffic Observation
On throughput-cadence ticks, the engine adapter queries Prometheus for traffic
metrics from either the frontend or router, depending on
throughput_metrics_source:
- request count
- average input sequence length (ISL)
- average output sequence length (OSL)
- KV hit rate
- speculative decode accept length
The observation window is throughput_adjustment_interval_seconds, while the
outer pipeline cadence remains scheduling.scale_interval_seconds.
Step 2: Load Prediction
The planner forecasts three traffic-shape values for the next interval:
next_num_req: Number of requestsnext_isl: Average input sequence lengthnext_osl: Average output sequence length
Four predictor implementations are available:
All predictors support warm-starting from trace files (--load-predictor-warmup-trace).
Runtime metadata that describes engine/router behavior is not forecast with
these predictors. KV hit rate and speculative decode accept length use
last-value semantics: the planner stores the latest valid Prometheus
observation and reuses it until a newer valid value arrives. Cold start falls
back to no KV hit-rate discount and accept length 1.0.
Step 3: Capacity Estimation
builtin_throughput_propose consumes same-tick predictions and asks the
planner perf model for prefill/decode capacity under the configured SLA
targets. The perf model is bootstrapped from the first available source:
- worker
get_perf_metricsself-benchmark data - AI Configurator interpolation when
aic_interpolationis present profile_results_dirNPZ/JSON fallback data- live FPM regression warmup when no pre-deployment data is available
The Rust perf shim can use native AIC estimates and online FPM tuning. Runtime metadata such as KV hit rate and speculative accept length are applied as input features, not as persistent correction-factor flags.
Step 4: Proposal and Lower Bound
The throughput proposer converts predicted load and per-engine capacity into replica targets. When both throughput and load scaling are enabled, throughput-based scaling writes a lower bound; the faster load-based proposer can scale above that bound but will not scale below it.
Step 5: Scaling Execution
The merged pipeline result becomes PlannerEffects.scale_to. The runtime base
then calls the configured connector to apply component replica targets.
Connector Design
Interface
KubernetesConnector
Directly PATCHes the DGD resource to update replica counts. The operator watches for DGD changes and reconciles component deployments.
Design decisions:
- Uses
DYN_PARENT_DGD_K8S_NAMEto find its parent DGD (injected by operator) - Resolves services by
subComponentTypefield (prefill/decode), with fallback to legacy component names - Validates deployment structure on startup: checks that prefill and decode services exist and model names match
VirtualConnector
For non-native environments (e.g., custom orchestrators). Writes scaling decisions to the distributed runtime via VirtualConnectorCoordinator (Rust binding). External systems use VirtualConnectorClient to poll decisions and report completion.
Scaling decision flow:
- Planner writes
(num_prefill, num_decode, decision_id)to runtime - External system reads decision via
client.wait() - External system executes scaling
- External system reports completion via
client.complete(decision) - Planner sees
scaled_decision_id >= decision_idand proceeds
Timeout: If scaling isn’t acknowledged within 1800s (configurable), the planner proceeds with new decisions anyway.
Performance Interpolation
The planner uses pre-deployment profiling data (NPZ files) to map (throughput, ISL/OSL, context_length) -> (TTFT, ITL). This data comes from the SLA-driven profiling process (either online GPU profiling or AI Configurator estimation).
Two interpolators are maintained:
- Prefill interpolator: Maps (throughput_per_gpu, ISL) -> TTFT
- Decode interpolator: Maps (throughput_per_gpu, context_length) -> ITL
The interpolators use the profiling sweep granularity to determine precision. Finer granularity means more profiling samples but more accurate interpolation.
Initialization
The python -m dynamo.planner entrypoint loads PlannerConfig, constructs
the mode-specific planner wrapper, and then initializes the selected
connector. The runtime base validates worker topology, discovers worker
capabilities, installs any available pre-deployment FPMs into the perf model,
bootstraps builtin and configured plugins, and enters the tick loop.
Performance Considerations
- Adjustment interval sizing: The plugin execution interval must be long enough for scaling operations to complete. If
load_adjustment_interval_secondsorthroughput_adjustment_interval_secondsis shorter than the time to add/remove a worker (which includes pod scheduling, model loading, and registration), scaling decisions may observe an in-progress replica transition and hold until it completes. - Perf-model bootstrap quality: Throughput-based scaling can start from worker self-benchmark data, AI Configurator interpolation,
profile_results_dirfiles, or live FPM regression. Missing bootstrap data is allowed, but early decisions may hold until enough live FPM observations arrive. - Interpolation accuracy vs profiling cost: Higher
prefillInterpolationGranularityanddecodeInterpolationGranularityin the profiler sweep produce more accurate bootstrap data but increase profiling time linearly. Default granularity (16 prefill, 6 decode) balances accuracy with profiling duration. - Predictor warm-up period: All predictors need observation history before making reliable forecasts. ARIMA and Prophet need multiple adjustment intervals of data. Kalman starts forecasting after
--kalman-min-pointsobservations. During warm-up, the planner uses the constant predictor as fallback.
Load-Based Scaling
The load-based mode uses ForwardPassMetrics (FPM) from the Dynamo event plane to make SLA-aware scaling decisions without requiring profiling data or the KV Router.
Metrics
Each engine emits per-iteration ForwardPassMetrics via ZMQ -> FpmEventRelay -> event plane. The planner subscribes via FpmEventSubscriber with automatic engine discovery and MDC-based lifecycle tracking. Key fields used:
- wall_time: per-iteration execution time (regression target)
- scheduled_requests.sum_prefill_tokens: prefill regression input
- scheduled_requests.sum_decode_kv_tokens: decode regression input
- queued_requests: queued prefill/decode load for TTFT/ITL simulation
- Idle heartbeats (wall_time=0) are skipped
Diagnostics
Each tick, the scaling state machine fills TickDiagnostics with intermediate decision data—estimated latencies, predicted load, per-engine RPS, and decision reasons—via internal _diag_* fields. The adapter layer reads this from PlannerEffects.diagnostics and:
- Sets Prometheus gauges (e.g.
dynamo_planner_estimated_ttft_msand related estimates) - Records enum metrics for load-scaling decision reasons (
dynamo_planner_load_scaling_decision) - Feeds
DiagnosticsRecorder, which accumulates per-tick snapshots and emits Plotly-based HTML reports on a schedule
Per-engine FPM queue depths from _collect_fpm() are exported as labeled Prometheus gauges.
Regression Models
Three specialized regression models live under
components/src/dynamo/planner/core/perf_model/:
- PrefillRegressionModel: 1D regression
sum_prefill_tokens -> wall_time. Estimates TTFT by simulating chunked prefill scheduling (chunks ofmax_num_batched_tokens). - DecodeRegressionModel: 1D regression
sum_decode_kv_tokens -> wall_time. Estimates ITL for total decode load (scheduled + queued + avg decode length). - AggRegressionModel: 2D regression
(sum_prefill_tokens, sum_decode_kv_tokens) -> wall_time. Estimates both TTFT (simulated prefill with piggybacked decode) and ITL (decode with average piggybacked prefill).
Scaling Decisions
- Prefill/Decode: Scale up if ALL engines’ estimated TTFT/ITL > SLA; scale down if ALL < SLA * sensitivity
- Agg: Scale up if (ALL TTFT > SLA) OR (ALL ITL > SLA); scale down if (ALL TTFT < SLA * sensitivity) AND (ALL ITL < SLA * sensitivity)
- Only scales by +/-1 per interval (non-blocking with pending-desired guard: metrics continue to be observed while scaling is in progress, but no new scaling action is issued until the previous one completes)
Co-existence with Throughput-Based Scaling
When both modes are enabled, throughput-based scaling (longer interval) sets a lower bound on replicas while load-based scaling (shorter interval) handles real-time adjustments above that floor.
Aggregated Mode
In aggregated mode (--mode agg), engines handle both prefill and decode via chunked prefill. The planner maintains both TTFT and ITL regression models but uses per-worker time-averaged metrics (not instantaneous) for regression training to smooth out chunked prefill noise. Scale up if either prefill or decode signals overload; scale down only if both signal underload.
Known Limitations
- Adjustment interval vs scaling latency: If a plugin interval is shorter than the time to scale, later ticks may observe an in-progress transition and hold rather than stacking new replica changes.
- Average-based prediction: Throughput-based scaling uses average ISL/OSL, which may not represent bimodal or heavy-tailed distributions well.
- Single DGD scope: Each planner instance manages exactly one DGD. Multi-model/multi-DGD coordination is not supported.
Future Work
- Multi-DGD coordination for shared-cluster scenarios
- Distribution-aware interpolation (beyond mean ISL/OSL)
- Adaptive adjustment interval based on observed scaling latency